LAR 5304G Digital Landscape Representation II: Static, Dynamic
Assignment 01: Network Plan
Description
This assignment is aimed at producing a particular kind of orthographic plan for your study territories, focused on establishing first objects, fields, corridors and borders of significance and second networks of relations between those objects and fields as defined by exchanges of matter and energy, modulated by borders and transmitted along corridors. In other words: metabolism, spatialized.
Methodology
The drawings produced for this assignment should combine the traditional cartographic functions of standard orthographic maps — delineating objects, fields, corridors, and borders, with linework, fills, hatches, and labels — with the directional records of exchanges of matter and energy utilized in practices of systems diagramming. Unlike the traditional orthographic map, these drawings should record movement, recognizing that landscapes are not static; unlike systems diagrams, these drawings should be spatialized, recognizing the role of corridors and borders in organizing metabolism.
The Odum reading is recommended as an introduction to the aims and methods of system diagramming.
Study Projects
Students will select from one of five proposed but incomplete restoration engineering projects administered by Louisiana’s Coastal Restoration and Protection Authority in the Mississippi River delta:
> Diversion at Myrtle Grove
> Sand Mining at Scofield Island
> Sediment Delivery System at Bayou Dupont
> Siphon at Maurepas Swamp
> Terracing at Bayou Bienvenue
J.B. Jackson once defined landscape as a “synthetic space”, stating that landscapes are territories constructed by “speeding up and slowing down the processes of nature”. Each of these projects utilizes engineered landscape prosthetics to construct synthetic space; in these prosthetic landscapes, environmental processes and machinic elements collaborate and become co-dependent. Consequently, they are excellent sites for experiments in the representation of constructed landscape objects, engineered landscape processes, and background environmental conditions.
Workflow
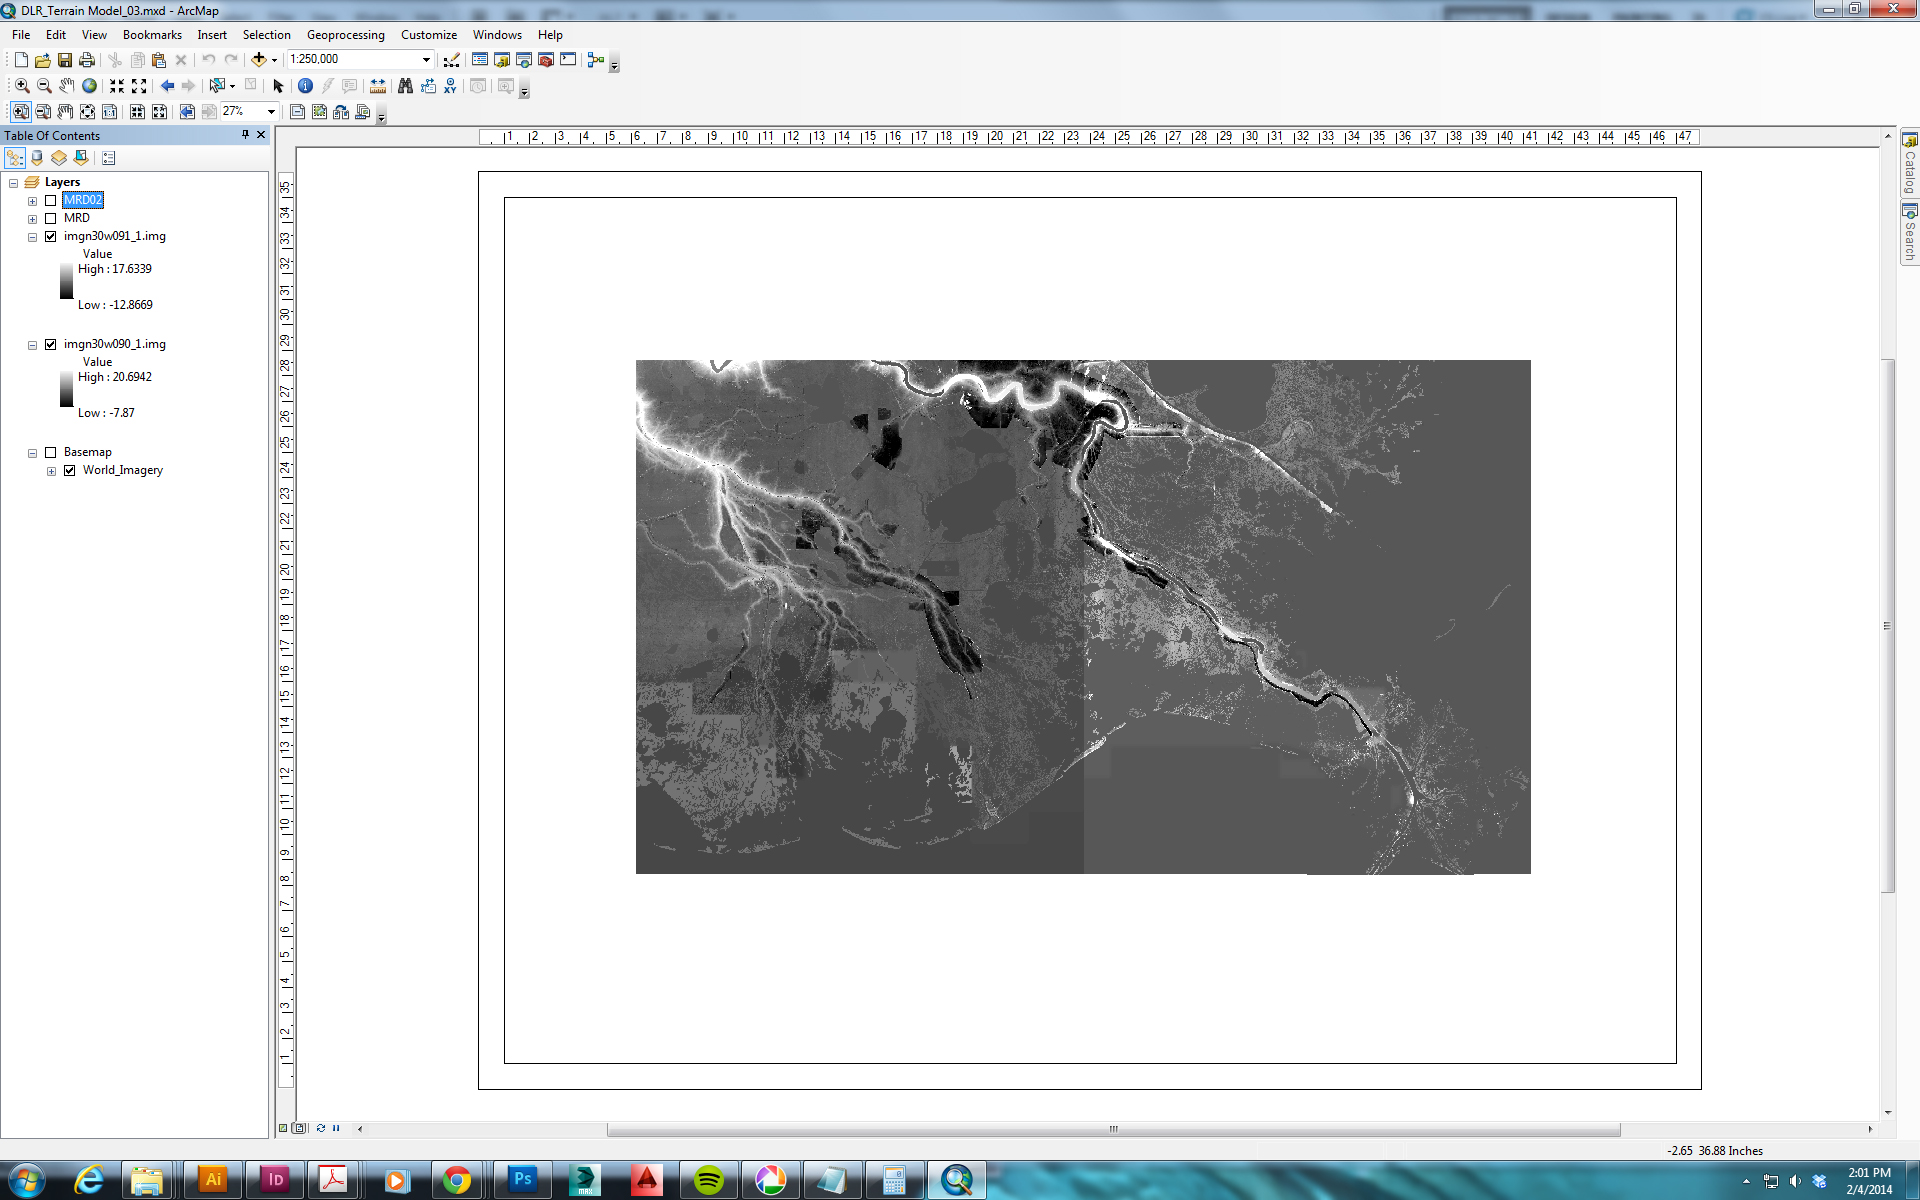
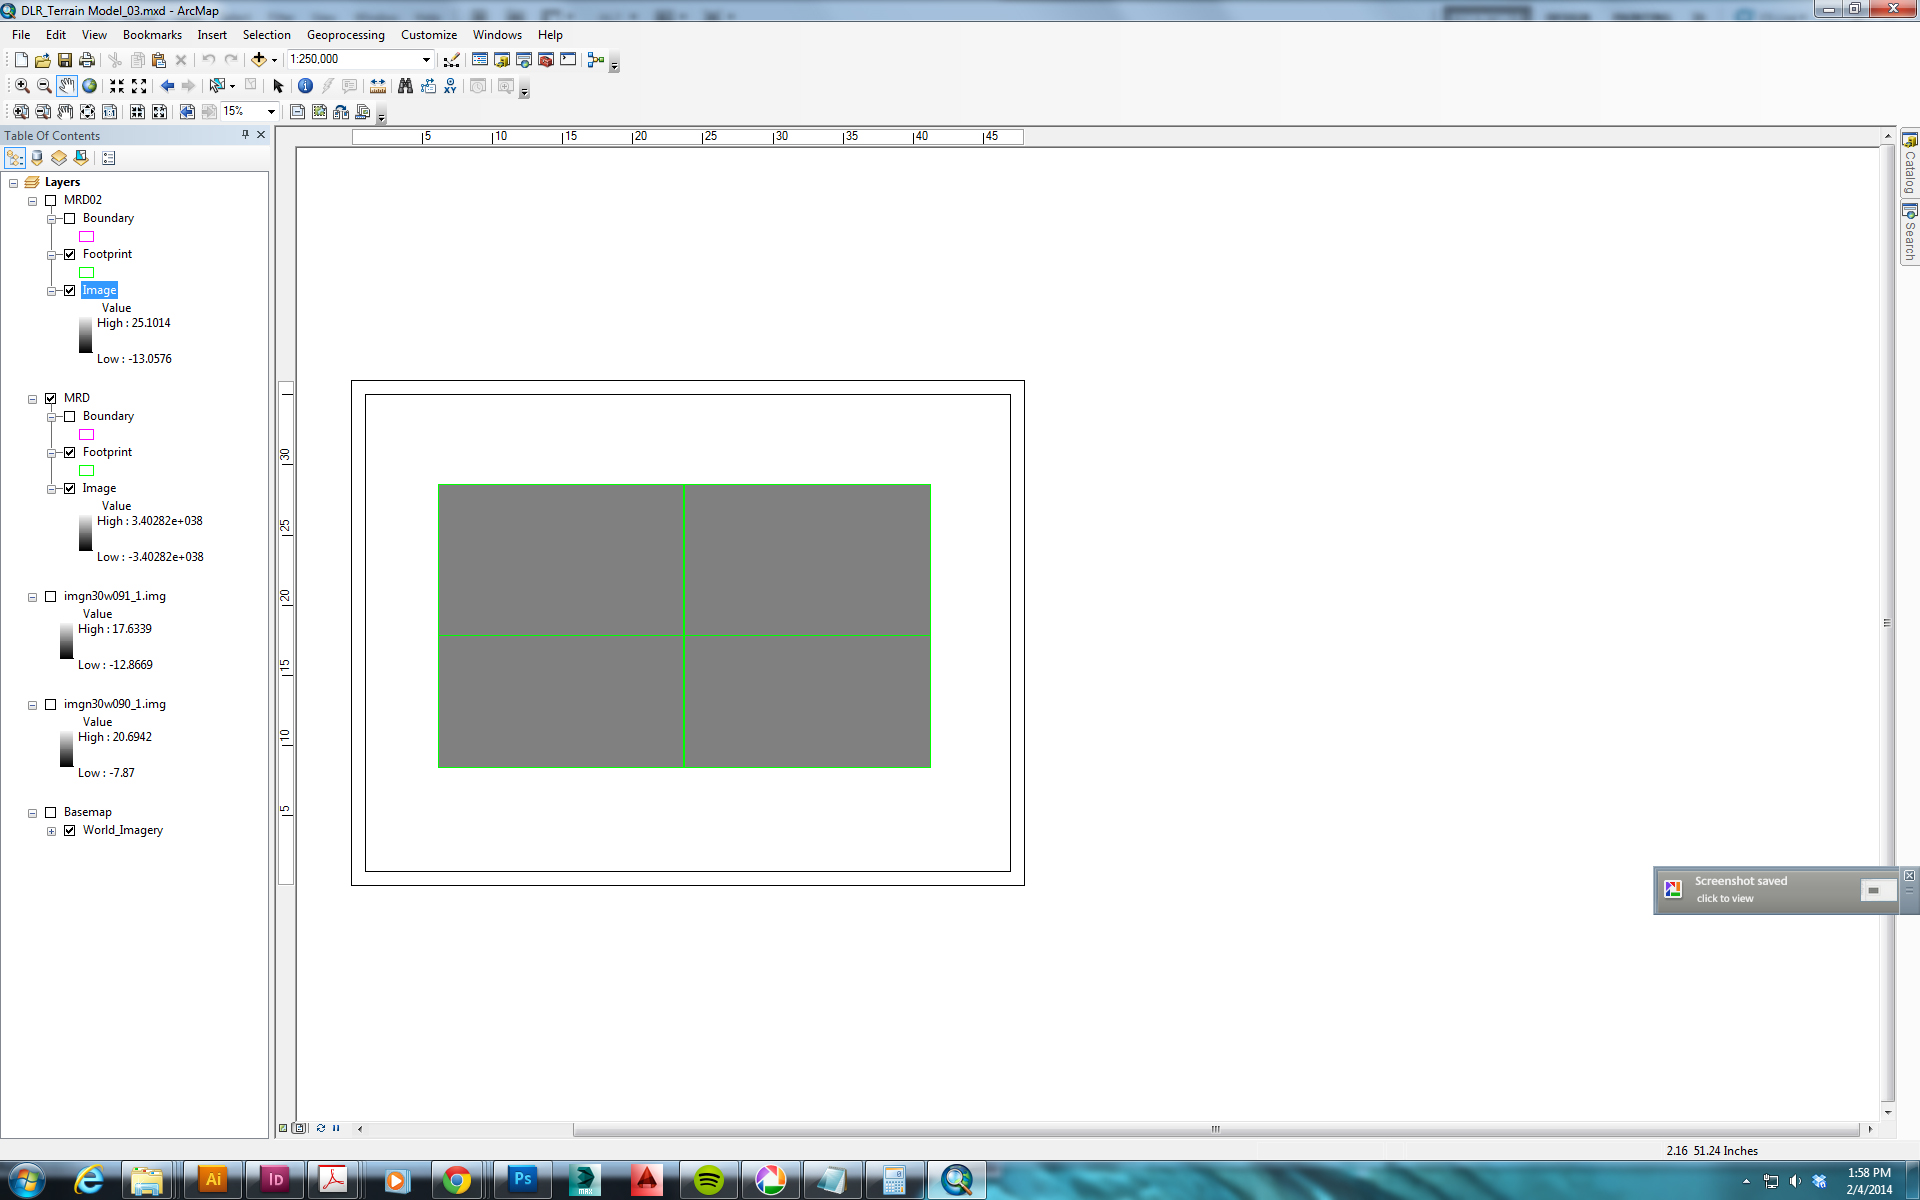
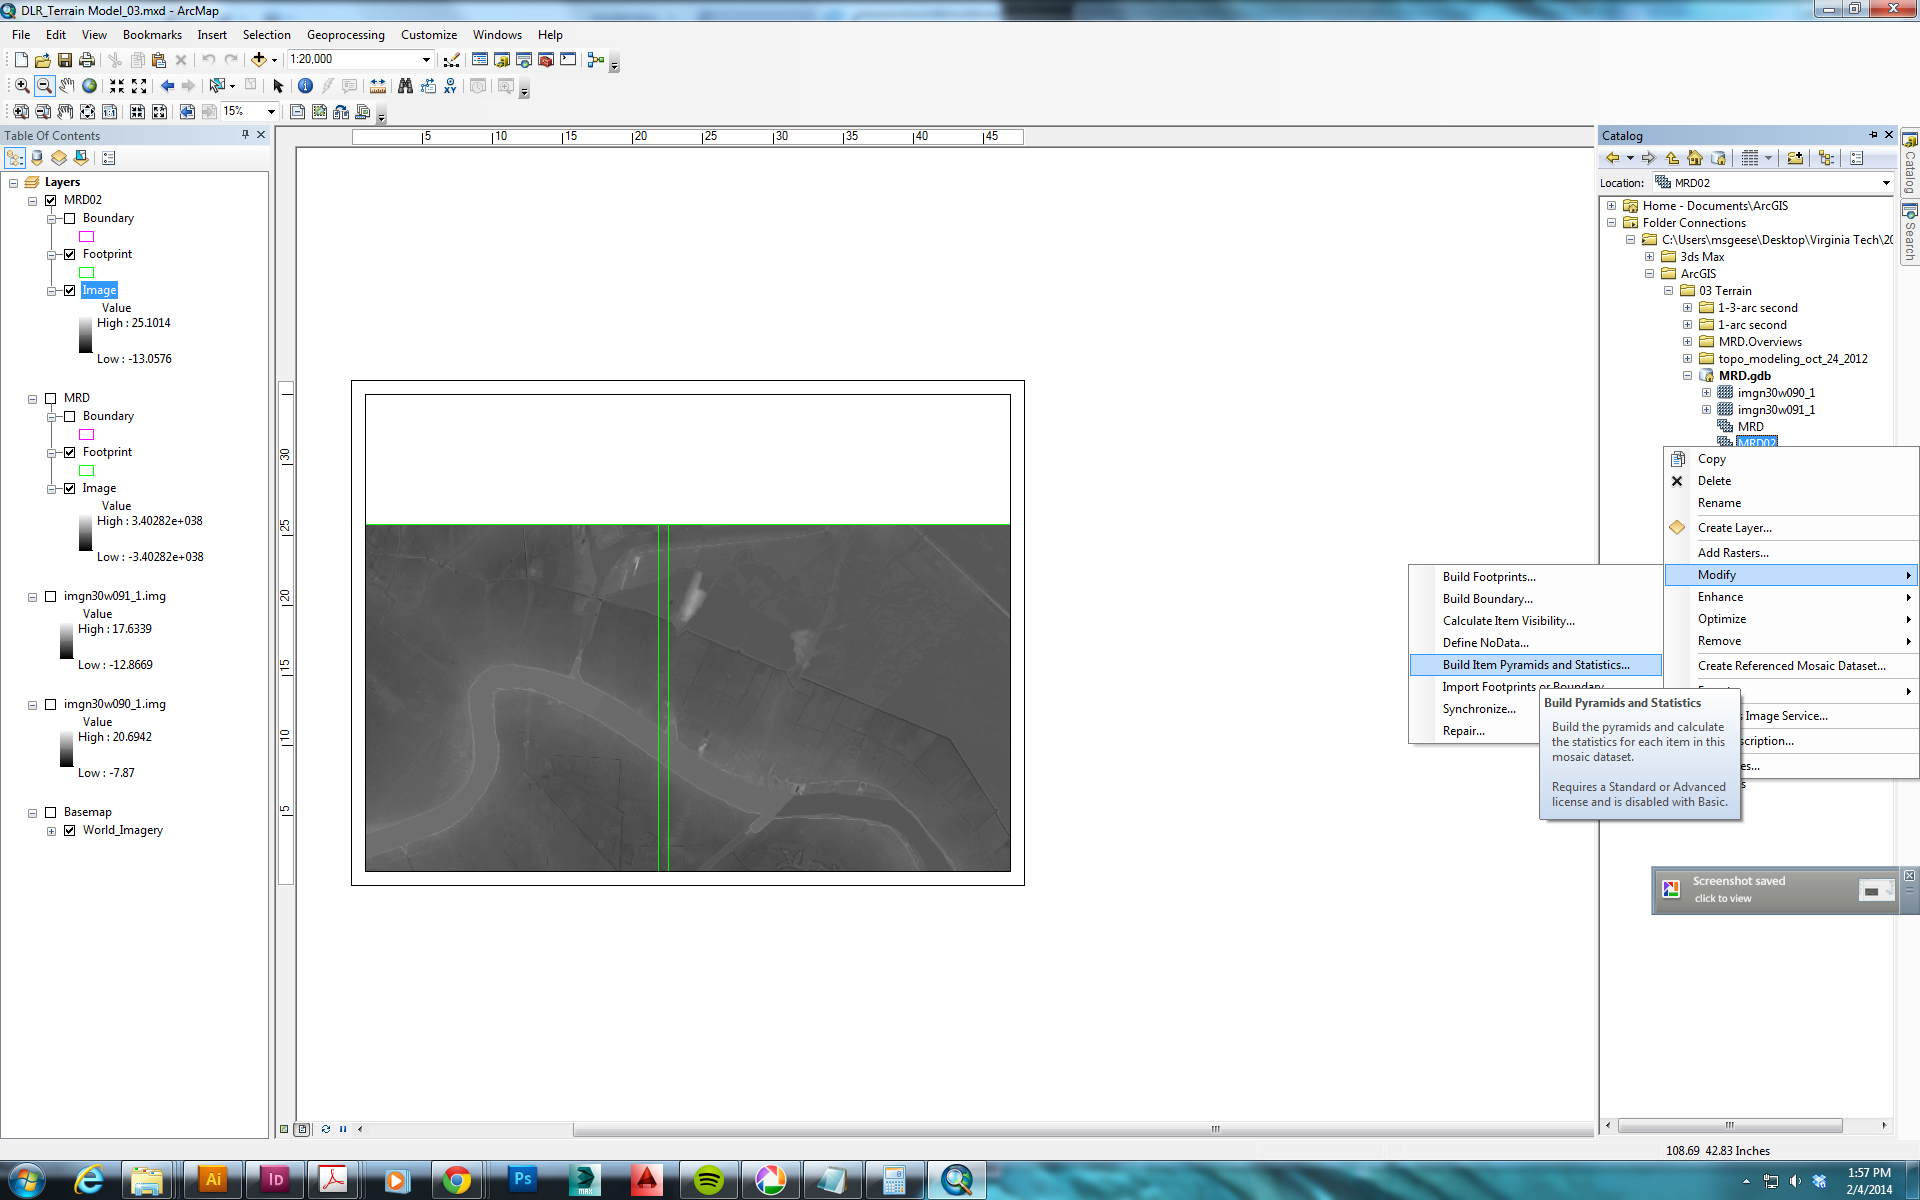
Students will export scaled satellite aerials as raster files from ArcGIS, overlay engineering drawings at scale on those aerial images in Photoshop, place base plans at scale in AutoCAD, create line work in AutoCAD, export linework to Illustrator, refine graphics and add color in Illustrator, and add annotations and labels in Illustrator.
Deliverables
1 Network Plan: an Illustrator file containing a single orthographic plan drawing.
> Identify important constituent parts of the study territory; depending on the study territory, these parts might be patterns of ownership, identifiable ecological conditions, infrastructures, settlements, water bodies, topographic features, and so on. These parts should be clearly labeled.
> Identify important movements of matter and energy within the study territory as well as into and out of the study territory. While it would be ideal to be able to quantify the scale of these flows, and you are encouraged to do so if data is available that permits this in either an absolute or relative fashion, it is not required. These movements should be identified and sorted in some fashion, such as by kind of material.
> A line-and-field drawing, utilizing distinctions in line weight, hatches, symbols, and fields of color as the primary means of delineating landscape conditions.
> Additive rather than subtractive or blanket use of aerial textures: this drawing should not use the base plan as a full-bleed background, but may judiciously utilize cropped components of the base plan or produced Photoshop textures to highlight key landscape elements.
> As a hybrid technical-illustrative drawing, this drawing should include both technical annotations such as measurements, spot elevations, contours, and underlying geometries and illustrative annotations such place names and descriptive labels.
Sources
Throughout every assignment for this course, you are expected to demonstrate good sourcing practices, for all visual, written, and intermediate products. This means both tracking your sources as you research and properly sourcing on all presented products. Sources should be clearly attributed directly on drawings.
Schedule
01 Th 1.23 Network Plan
Receive: Assignment 1: Plan
02 Th 1.30 Network Plan
Discuss plans.
08 Th 3.20 Critique
Covering Assignments 1, 2, and 3.
References
Systems Diagramming
Odum, Howard. “Systems, Networks, and Metabolism” in Environment, Power, and Society for the Twenty-First Century. 13-31.
Read More