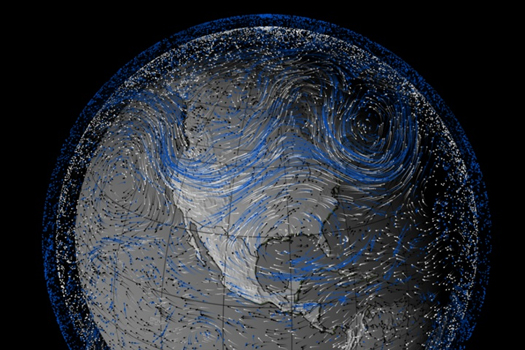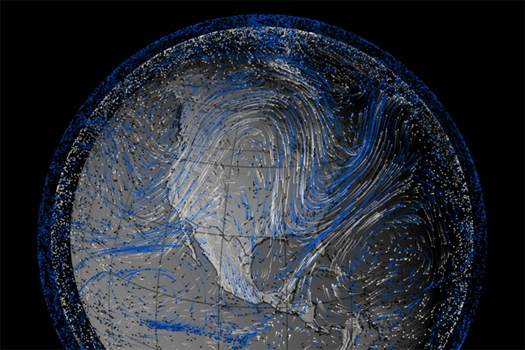
[A NASA visualization of the 1993 summer wind patterns that caused that year’s Mississippi floods:
“The arrows indicate wind trajectories, while color indicates wind height. The length of a line equates to wind speed (stronger winds get longer lines). Black arrows trace the low-altitude winds that carry moisture, the winds most relevant to the 1988 drought and 1993 floods. These winds are about 1,500 meters (4,900 feet, 850 millibars) above the surface. White arrows are winds at 5,400 meters (18,000 ft, 500 mb), and blue arrows are high-altitude winds at about 9.2 kilometers (30,000 ft, 300 mb).”]

[For comparison, winds from the same period (the beginning of May to the end of July) in 1988, a year of drought that also devastated the Midwest, but in opposite fashion. Note that in 1993, the high-pressure, low-altitude winds (black arrows) flow freely up from the Gulf of Mexico, bringing moisture-laden air to the Midwest, while in the 1988, a high-pressure system hovered over the Midwest, pushing air south and blocking movement of moist air from the Gulf of Mexico. To really appreciate the difference, you’ll want to watch the animated versions — 1988 here and 1993 here. (Note those links are to download sizable video files.)]

