mammoth // building nothing out of something

hamburg, iowa


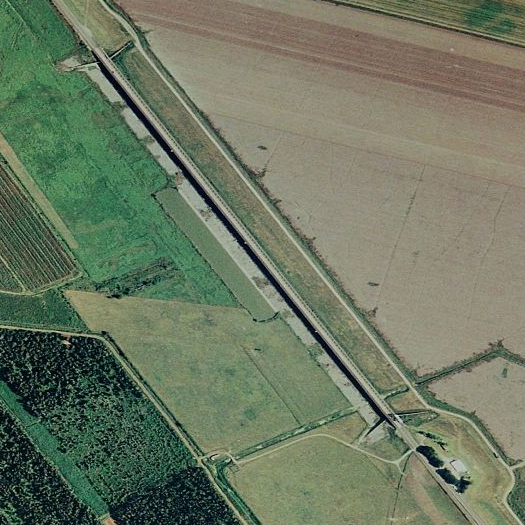
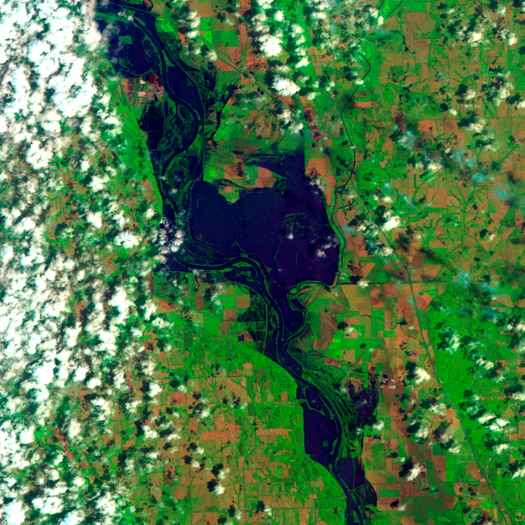
[False-color satellite imagery of flooding along the Missouri River near Hamburg, Iowa:

“On June 19, 2011, the AHPS reported, the Missouri crested slightly above the record level set for Brownville [Nebraska, about 15 miles downstream from Hamburg] in 1993. The record level was 44.3 feet (13.5 meters), and on June 19, the river briefly reached 44.62 feet (13.60 meters) before receding slightly.”

Hamburg was threatened by a levee breach on June 5, which prompted the evacuation of approximately half of the town’s twelve hundred residents, and the emergency construction of a secondary levee closer to the town.  Fortunately — for the town of Hamburg, that is — another levee breach near Brownville has taken pressure off the secondary levee, and as the waters have dropped a couple feet, the town appears safe, at least for the time being.  Flooding along the Missouri, though, is expected to continue throughout the summer.]


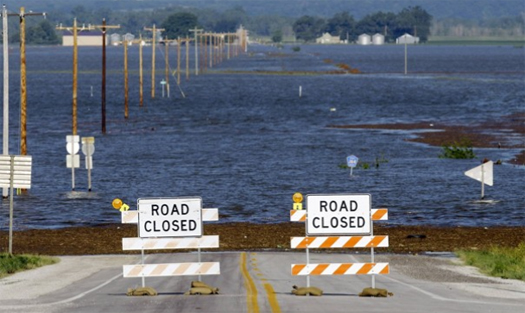
[Floodwaters cover a highway near Hamburg; photograph by Charlie Neibergall/AP.]

“a coordinated infrastructural ensemble”

In a great little piece for Domus, Geoff Manaugh looks at what the “critical foreign dependencies” cable says about the nature of the contemporary nation-state:

“The sites described by the cable—Israeli ordnance manufacturers, Australian pharmaceutical corporations, Canadian hydroelectric dams, German rabies vaccine suppliers—form a geometry whose operators and employees are perhaps unaware that they define the outer limits of US national security. Put another way, the flipside of a recognisable US border is this unwitting constellation: a defensive perimeter or outsourced inside, whereby the contiguous nation-state becomes fragmented into a discontiguous networkstate, its points never in direct physical contact. It is thus not a constitutional entity in any recognised sense, but a coordinated infrastructural ensemble that spans whole continents at a time.”

In other words, not only is Wyoming in Los Angeles; but America is in Canada, or Canada is in America, or both at the same time.

project design flood


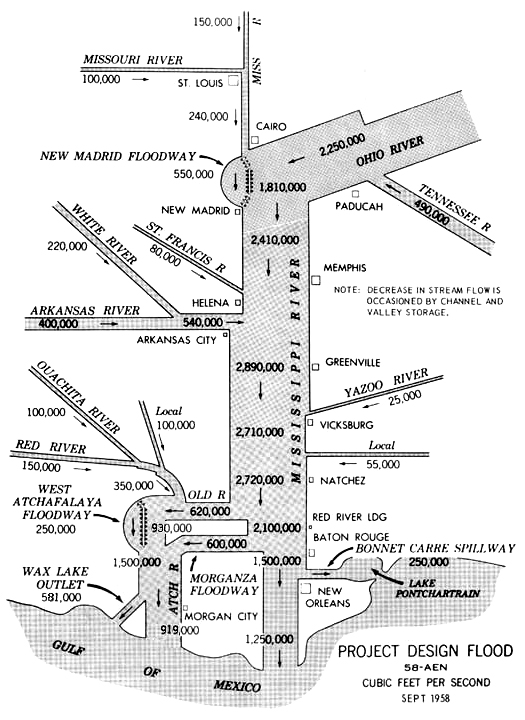
[The “project design flood” is the maximum flood that the Army Corps of Engineers has engineered the Mississippi River’s flood control structures to accommodate; the image here (via America’s Wetland and Loyola University) shows those flows in cubic feet per second.

I’ve been slow to link (though, as promised, the flood blogging is going to pick back up now) to Brett Milligan’s great post on how the 1927 floods produced a massive shift in the strategies used to control the Mississippi River, and how we tend to forget those changes; at any rate, the post says the following in discussing the image above:

“The strategies generated by the the floods of 1927 seem to have been pretty close to a paradigm shift for the Army Corps of Engineers’ then current river control strategies.  There was a hard realization that all those miles of levees that worked at a regional scale were impossibly small play things when it came to dealing with above average stormwater drainage funneled from 41% of the land surface of the nation (a definition of an event landscape).  Rather than just making the levees taller and thicker (which they did), they also made some well-observed retroactive moves by actually giving way to the river at some of their weakest levees points through the creation of the floodways (the Bonnet Carre Spillway is located where a levee had failed multiple times).  By expanding the infrastructure and creating release valves, the river was still under control, but only by giving it back its floodplains when its asks for them.

Like floods themselves, the floodways are stealthy features in the landscape.  Covered in crops and green leafy things much of the time, their systemic function and appropriation slips to the background in the calm between the big events.  When the floods return, the Army Corps is forced to dust off their presentation boards and attend the requisite media circus to review the instrumental theory designed and codified over 50 years ago, which produced a diagram with such persistent instrumental effect that Deluzians should appreciate.”

Read the whole post at Free Association Design.]

2011

In NASA Earth Observatory’s latest image of the Mississippi River Valley, floodwaters from this spring’s historic flooding — “the floodwaters have been the highest on record at more than half of the gauges along the [levees] between Missouri and Louisiana” — are receding, and the river crested back on the 31st of May at Morgan City, the Atchafalaya’s outlet point to the Gulf and the southernmost point to experience flood stage.  Yet gauges up and down the river remain at flood stage.  In Louisiana, flooding is concentrated along the Mississippi upstream from the open Bonnet Carre Spillway: Baton Rouge records major flooding (here, “major flooding” refers to the height above flood stage on the gauge, not the horizontal spread of water), while both Red River Landing and Morgan City remain at moderate.  Though flooding through the Atchafalaya basin and at Morgan City has not been as bad as initially feared, it could be a month before floodwaters are no longer a concern in Morgan City.  And, of course, Morgan City also lies in the path of flooding from the opposite direction: the hurricane season, which began June 1st, “is expected to be busier than normal, with government forecasters predicting there could be as many as 18 named tropical storms”.  Further up river, waters remain at minor or moderate flood stage in both Mississippi and Arkansas.

[I’ve found far more that I want to talk about than I originally anticipated when I started posting about floods a couple weeks ago, so it turns out that this week or two is probably going to stretch towards a month or two. I’ve just gotten, as the title of this post indicates, to the point where I’m ready to start talking about this year’s Mississippi floods, and there is a great deal to discuss: specific sites of fascination like the concrete revetment construction yards of St. Francisville, the racial politics of media coverage of flood control, a number of design proposals for flooded landscapes, sand boils, how to think about flood control, and so on.  While there is probably going to be a slowdown in posting over the next week or two, (I am, as previously mentioned, off to Visualizar next week) don’t worry (I know! You were really, really worried that a blog might post less frequently!) — the flooding will resume shortly.]

cubit’s gap


[Cubit’s Gap, Louisiana]

FASLANYC reports on the Mississippi as a “land-making machine”, vividly illustrated by the case of Cubit’s Gap:

“…let’s consider the case of Cubit’s Gap, a major subdelta of the [Mississippi].  The gap formed in 1862 after an oyster fisherman (Cubit) and his daughters excavated a small ditch in the natural levee between the Mississippi River and the oyster-rich Bay Ronde in order to portage their fishing boat more easily.  The following spring floodwater poured through, gouging a crevasse and depositing sediment.  Six years later the crevasse was 2,427 feet wide.  By 1940 a landmass larger than New Orleans had been created and the Bay Ronde had completely disappeared.  Today, the Cubits Gap subdelta is 40,000 acres of national wildlife refuge and is quickly subsiding back into the Gulf of Mexico.”

“winds of drought, winds of flood”


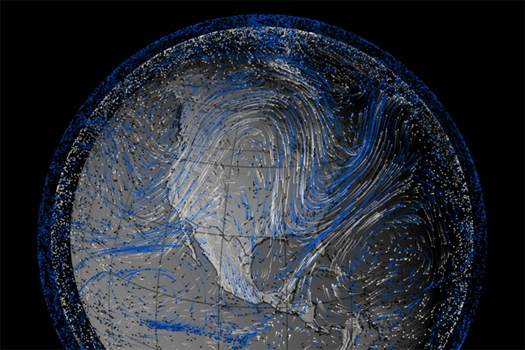
[A NASA visualization of the 1993 summer wind patterns that caused that year’s Mississippi floods:

“The arrows indicate wind trajectories, while color indicates wind height. The length of a line equates to wind speed (stronger winds get longer lines). Black arrows trace the low-altitude winds that carry moisture, the winds most relevant to the 1988 drought and 1993 floods. These winds are about 1,500 meters (4,900 feet, 850 millibars) above the surface. White arrows are winds at 5,400 meters (18,000 ft, 500 mb), and blue arrows are high-altitude winds at about 9.2 kilometers (30,000 ft, 300 mb).”]


[For comparison, winds from the same period (the beginning of May to the end of July) in 1988, a year of drought that also devastated the Midwest, but in opposite fashion.  Note that in 1993, the high-pressure, low-altitude winds (black arrows) flow freely up from the Gulf of Mexico, bringing moisture-laden air to the Midwest, while in the 1988, a high-pressure system hovered over the Midwest, pushing air south and blocking movement of moist air from the Gulf of Mexico.  To really appreciate the difference, you’ll want to watch the animated versions — 1988 here and 1993 here.  (Note those links are to download sizable video files.)]

1993


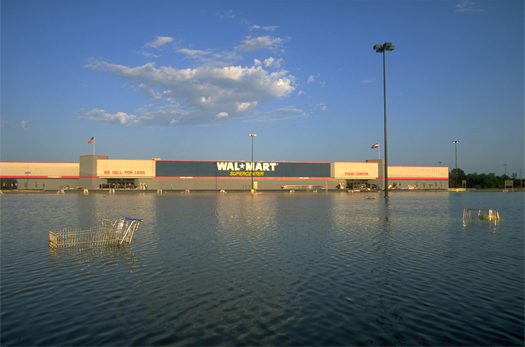
[A Wal-Mart in Festus, Missouri, photographed on July 9, 1993.  The Great Mississippi and Missouri Floods of 1993 were the most costly in the history of the United States, causing some $15 billion in damages, and inundating vast swathes of North Dakota, South Dakota, Nebraska, Kansas, Minnesota, Iowa, Missouri, Michigan, Illinois, and Indiana.  In some locations, flood conditions persisted for a record-breaking 200 days.  Because the Ohio Valley was relatively dry that spring and summer, the flooding was confined to the Upper Mississippi.]

red river landing


[Red River Landing, Louisiana]

It’s not all that easy, actually, to rank the severity of the 20th century’s great Mississippi floods.  One reason is that Mississippi River flooding is often primarily on the upper Mississippi (1993) or the lower Mississippi (1973, 1983), which makes like-to-like comparison difficult.  Another is that there are so many different ways to measure the severity of a flood, even at a single geographical point.  Take the Red River Landing Gauge, the Army Corps’ monitoring apparatus just below the Old River Control.

The Corps uses the Gauge to measure flood severity by three conditions: stage (flood height in feet above “gauge zero”, which is the elevation of the river’s surface at average low flow), volume (of flow), and “days in flood” (the period of time for which the river’s stage has been above the elevation determined to be “flood stage”; at Red River Landing, this is 48 feet).

By stage the worst flood measured in the 20th century at Red River Landing was 1997, which topped out at 61.3 feet, followed by 1927 at 60.9 feet.  (Just a few days ago — 26 May, if I read the Corps’ website properly — the Gauge recorded 62.13 feet, which exceeds any measurement taken in the 20th century.  At the time of this writing, 2 June, it is currently at 60.9 feet, and predicted to continue gradually decreasing tomorrow.)  By volume, it was easily 1927, which at 1799 Kefs dwarfed 4th-placed 1997’s 1480 Kefs.  The increased channelization of the river and the effects of implemented flood control measures are seen in the discrepancy between these numbers — because the horizontal space available to the flooding river diminished so much between 1927 and 1997, and the river was encouraged to take faster paths to the delta, it took a significantly smaller flow of floodwater to produce a slightly higher flood stage.  This is anthropogenically accelerated flooding.  Finally, by days in flood, 1927 is again the clearly most severe flood, with 135 days, and trailed by 1983’s 115 days.  No other floods lasted more than a 100 days.

morganza floodway


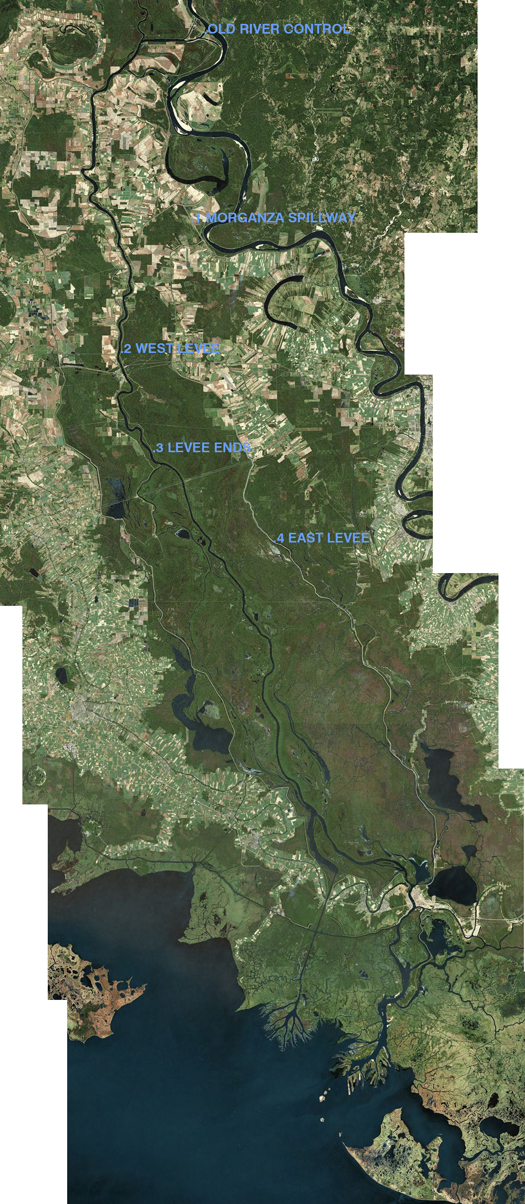
[1. The Morganza Spillway, the 3,900-foot control structure that sits at the north end of the Morganza Floodway, in drier times.  It “consists of a concrete weir, two sluice gates, seventeen scour indicators, and 125 gated openings”.]


[2. A levee on the western side of the Morganza Floodway, near Krotz Springs.]


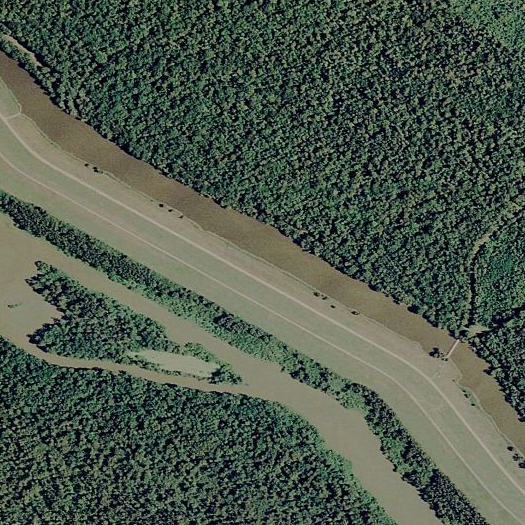
[3. The southern terminus of the Morganza floodway, somewhere around 10 miles south of Krotz Springs.]


[4. The levee on the eastern side continues far south of the western levee, as the Morganza Floodway joins the West Atchafalaya Floodway to become the Lower Atchafalaya Basin Floodway.  When floodwaters come this far south on the Morganza Floodway, they stop moving solely southward, and begin to spread both south towards the Atchafalaya Delta as well as back north up the route of the West Atchafalaya Floodway, as detailed in this predictive map from the Army Corps of Engineers.  Eventually, as they exit the lower floodway, they make their way around the pictured eastern levee and turn north a second time, so that the levee is eventually a thin, isolated dry strip.]


[Satellite view of the Atchafalaya Basin, including all three floodways.]

1973


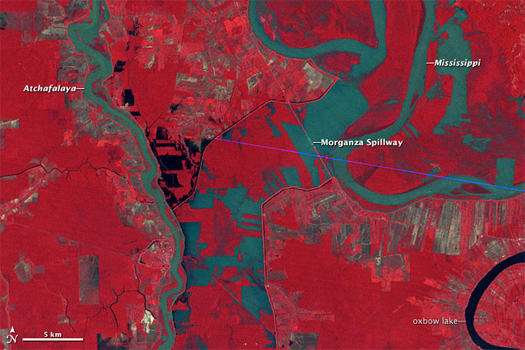
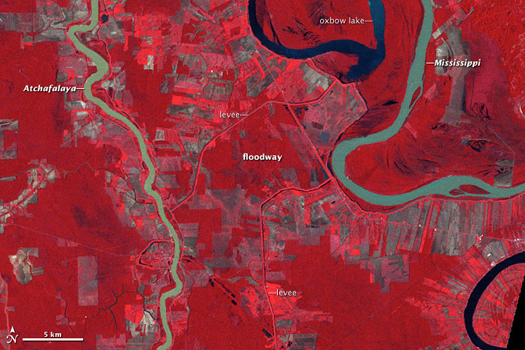
[You may recall that our posting on floods began with an image quite like the two above.  That first image was, like these two, a false-color satellite image of the open Morganza Spillway; but where the first image was taken in May, the two above were taken on May 5, 1973 and April 6, 1977 (respectively) — May 5, 1973 being only other time that the Morganza Spillway has been opened.  In 1973, intense flooding on the lower Mississippi threatened to overwhelm the Old River Control Structure (as well as downriver levees), and the Spillway was opened.]


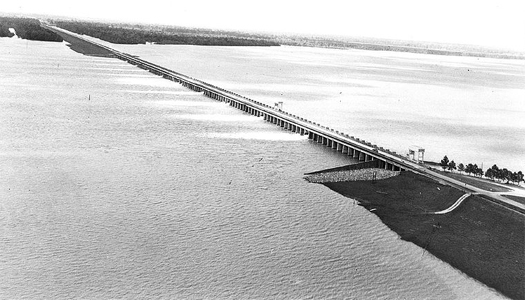
[Aerial view of the opened spillway, May 1973.]

In “Atchafalaya” — our Mississippi floods ur-text, from The Control of Nature, John McPhee writes:

“Every shopping center, every drainage improvement, every square foot of new pavement in nearly half the United States was accelerating runoff toward Louisiana. Streams were being channelized to drain swamps. Meanders were cut off to speed up flow. The valley’s natural storage capacities were everywhere reduced. As contributing factors grew, the river delivered more flood for less rain. The precipitation that produced the great flood of 1973 was only about twenty per cent above normal. Yet the crest at St. Louis was the highest ever recorded there. The flood proved that control of the Mississippi was as much a hope for the future as control of the Mississippi had ever been. The 1973 high water did not come close to being a Project Flood. It merely came close to wiping out the project.

While the control structure at Old River was shaking, more than a third of the Mississippi was going down the Atchafalaya. If the structure had toppled, the flow would have risen to seventy per cent. It was enough to scare not only a Louisiana State University professor but the division commander himself. At the time, this was Major General Charles Noble. He walked the bridge, looked down into the exploding water, and later wrote these words: “The south training wall on the Mississippi River side of the structure failed very early in the flood, causing violent eddy patterns and extreme turbulence. The toppled training wall monoliths worsened the situation. The integrity of the structure at this point was greatly in doubt. It was frightening to stand above the gate bays and experience the punishing vibrations caused by the violently turbulent, massive flood waters.”

If the General had known what was below him, he might have sounded retreat. The Old River Control Structure—this two-hundred-thousand-ton keystone of the comprehensive flood-protection project for the lower Mississippi Valley—was teetering on steel pilings above extensive cavities full of water. The gates of the Morganza Floodway, thirty miles downstream, had never been opened. The soybean farmers of Morganza were begging the Corps not to open them now. The Corps thought it over for a few days while the Old River Control Structure, absorbing shock of the sort that could bring down a skyscraper, continued to shake. Relieving some of the pressure, the Corps opened Morganza.”

We’ll return to the Old River Control soon.

unusual flood typologies iii: devils lake


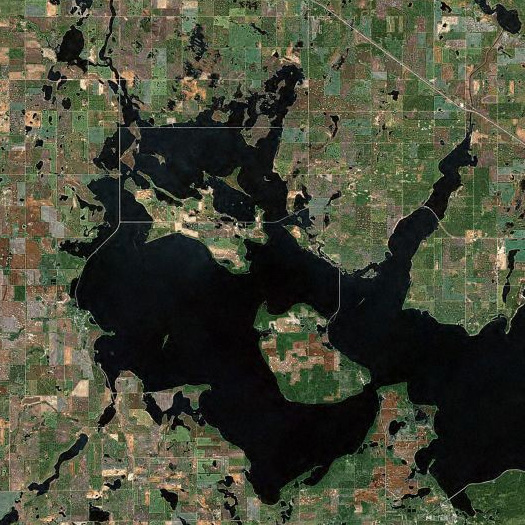
[Top, Devils Lake, North Dakota — a glacial lakebed which has been slowly rising since 1992:

“Unlike with a river flood, this water does not naturally recede after a week or a month. It has nowhere to go: The lakebed is the result of a glacier that melted roughly 10,000 years ago, and its only natural outlet is at 1,458 feet above sea level. Since August 1992, the lake has risen more than 29 feet. That would be a remarkable increase in nearly any body of water, but in the context of North Dakota’s famously flat topography it is extraordinary; here, the rising lake spreads across the land like water spilled on a table. At the lake’s current size, a one-foot rise consumes more than 15,000 acres of surrounding land. In 19 years it has grown from roughly 69 square miles to 285, an area about the size of Fort Worth, Texas.

In recent years the lake has become so massive that it has begun a sort of self-perpetuation through its influence on the local weather. The body of water adds so much moisture to the lower atmosphere that it may well be increasing the amount of precipitation the area receives. And on summer nights in Minnewaukan you hardly need the A/C anymore. Nice for sleeping, perhaps, but the cooler air means less evaporation, more standing lake.”

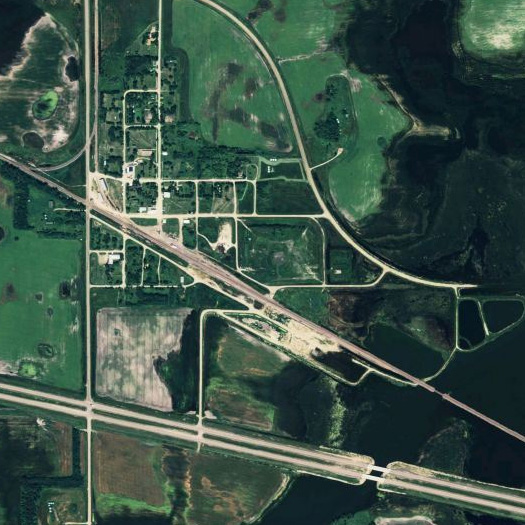
Above, the nearly abandoned town of Churches Ferry on the western edge of Devils Lake.  In the late nineties, FEMA determined that the town would inevitably be swallowed by the lake, flood control measures or no flood control measures, and, rather than futilely build barriers, bought out every willing resident of the town.  Leaving 12.

Read about Devils Lake and Churches Ferry in Lisa Hamilton’s two-part series for the Atlantic; link via Nam Henderson.]

mound crevasse


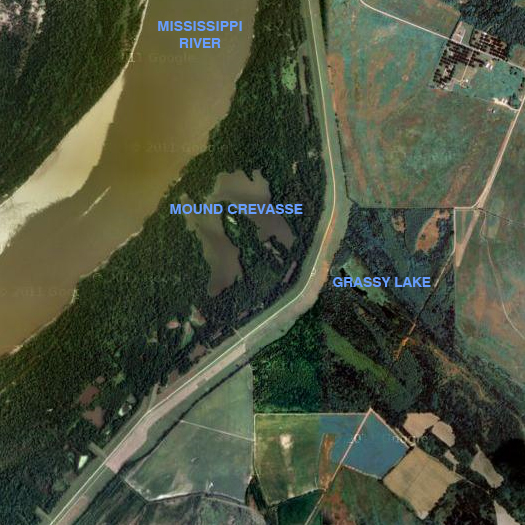
[Mound Crevasse; the explosive force of the 1927 levee break remains visible in the blast-like pattern of lakes and shredded terrain that is clearly visible in this current satellite image.]

If you look closely at the Army Corps’ map of the 1927 Mississippi floods from a couple posts back, one of the major patterns that emerges is that virtually all the flooding is on the western side of the river.  (This is in part because snowfall during the winter of 1926 and rainfall in the spring of 1927 was concentrated to the west of the river, though it was also heavy in the Ohio Valley.  It is also because the most populated portions of the Mississippi River Valley lay to the east of the river, and so levee construction and emergency flood protection efforts concentrated on the east side.)

One major exception to this general rule is apparent, though, a massive blotch of flooding covering some five thousand square miles of Mississippi, stretching south and east from the river town of Greenville.  This is the result of the Mound Crevasse.
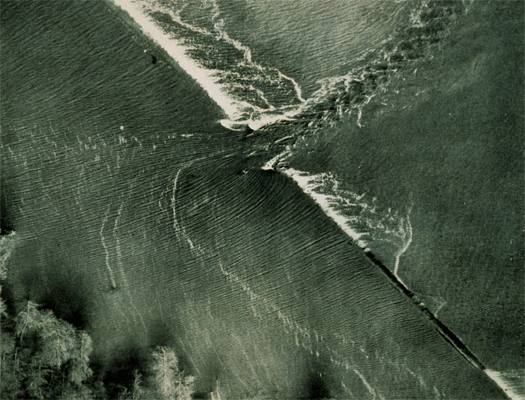

[Mound Crevasse, immediately after the levee breach.]

When a levee fails through structural disintegration (which often takes the form of undermining by floodwaters) rather than overtopping, it fails at a specific point.  That point is called a crevasse.  (As mentioned previously, crevasses can also be created intentionally to produce emergency floodways.)

On the morning of April 21, 1927, an Army district engineer wired the head of the Army Corps of Engineers:

“Levee broke at ferry landing Mounds, Mississippi eight a.m. Crevasse will overflow the entire Mississippi Delta.”

While engineers and Delta planters had long known Mounds Landing was a vulnerable point on the levee system, no one expected a disaster of this magnitude. Of all the breaches along the Mississippi, this would be the worst levee break of the entire flood. In fact, it is still noted as the worst levee break anywhere in the United States.

Four hundred and fifty men had worked through the night in a desperate effort to save the levee, but the river rose too fast. One worker recalled, “It was just boiling up. The levee just started shaking. You could feel it shaking.” In the early hours of the morning small breaks started to appear. Fifteen hundred additional men were rushed to the site, but their efforts could not save the levee. What had begun as a small break quickly became a raging river. Guards forced the African American laborers to keep filling sandbags at gunpoint, but everyone there could feel that the levee was about to collapse under their feet. Sandbags started to wash away, the river ran over the top of the levee, and men took off as fast as they could run. As the levee collapsed, many of the workers were swept away. Soon every fire whistle, church bell and mill whistle rang out to warn the county.

The force of the torrent was unstoppable, scouring out the land and uprooting everything in its path. Trees, buildings, and even railroad embankments were washed away in moments. Even Egypt Ridge, so named because no flood had ever reached it before, was soon engulfed. For 60 miles east of the crevasse and ninety miles south there was nothing but water. Where farms and towns had been, it looked like an ocean. Seventy-five miles away, in Yazoo City, the water was high enough to cover the roofs of homes. In a matter of days, 10 million acres of land would be under 10 feet of water.

The river poured through the break with a force greater than that of Niagara Falls.  (Footage of the levee breaks from 1927 — archived in the American Experience program “Fatal Flood” quoted above, can be seen here.)
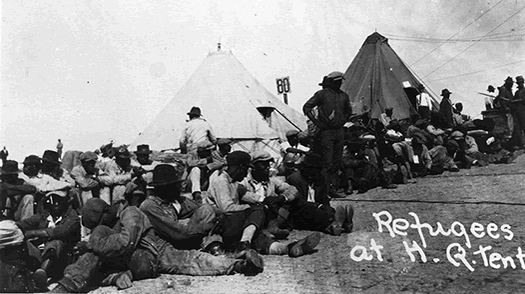

[Refugees near Greenville were forced to live on the river levee — the racist planters in charge of relief efforts for people driven out of their homes in Greenville feared that “if the blacks got out of the Delta, they would never return” (to pick cotton for the planters), and so they forced them to remain in a seven-mile long encampment on the levee.  “Black men were not allowed to leave–those who tried were driven back at gunpoint by the National Guard.”]

The Mound Crevasse was responsible for much of the most destructive flooding that occurred in the great flood of 1927.  Nearly one-fifth of the 27,000 square miles flooded that year were flooded by waters pouring through the Mound Crevasse.  Tens of thousands were left homeless; nearly two hundred thousand were displaced from their homes.

“It would take months for the water to recede. Five weeks after the levee collapsed, engineers surveying the crevasse found waves still as high as 12 feet and water deeper than 100 feet.”

As evidenced by the photograph at top, though, a crevasse does not disappear when the floodwaters recede — or even after the levee is rebuilt.  The gouging force of the Mound Crevasse left behind the depressions that became the eponymous lake and its smaller subsidiary, Grassy Lake, while the sedimentary expression of a crevasse is termed a crevasse splay deposit.  As a crevasse is an example of the reassertion of geological forces over and against the human control of nature, and, it is a perfect example of the infra-natural disaster.  Levee crevasses did not happen before flood control infrastructures were built, and cannot (by definition) exist apart from the intersection of infrastructure and natural disaster.  Where levees have held back the slow movement of the river as a geological force, a crevasse releases that tension quickly and at great concentration; when geological forces are compressed into a human time scale, the resulting disaster can be amplified.  This — compression and amplification — is a common characteristic of the infra-natural disaster.

Infra-natural disasters are also inevitably political.  Unlike the natural disaster, the damage caused by an infra-natural disaster has been channeled by the decisions someone somewhere made, and that means that both there is someone to blame for them (witness Katrina) and that — this is particularly apparent in the case of Mounds Crevasse — they have a tendency to become intertwined with other socio-political events.  The flood waters pouring through Mounds Crevasse paid no attention to the color of owners of the homes it destroyed; but, as noted above, the massive racial inequalities which dominated Mississippi politics at the time made the period after the flood even more awful for blacks than it was for whites.  (Even when Hoover, prior to his election as President, appointed a commission to investigate allegations about the abuses at the levee camps and the commission substantiated the claims made, the findings were suppressed.)
visualizar ’11


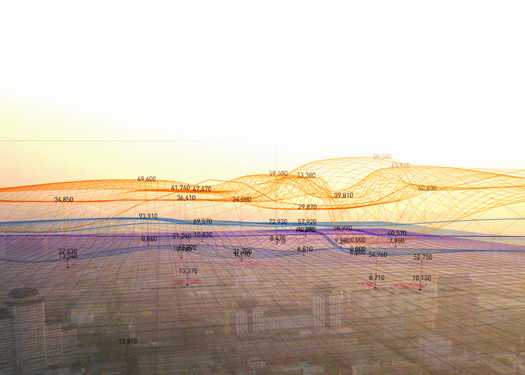
[Nerea Calvillo’s “In the Air” — “a visualization project which aims to make visible the microscopic and invisible agents of Madrid´s air” — Visualizar ’08]

A brief interruption to the flood-blogging (which will resume shortly, with more on 1927 and crevasses) to note that I’ll be speaking in Madrid at Visualizar ’11 “Understanding Infrastructures”.  The opening seminar, which runs from June 14-15, promises to be fantastic, featuring talks from Amber Frid-Jimenez, Dietmar Offenhuber, Drew Hemment, Tom Raftery, and Usman Haque on a wide range of topics related to the visualization of infrastructures: the “smart grid”; the politics and crafting of data; innovation in the development and deployment of infrastructures; and “the internet of obsolete objects”, as well as an array of selected papers.  The aim of the gathering as a whole — discussing and prototyping ways to reveal and interpret the operation of infrastructures — is similarly excellent, and if past editions of Visualizar are any guide, the workshop which follows the seminar is sure to produce worthwhile projects.

The program for Visualizar ’11 begins by quoting James Burke from Connections:

More and more of technology infiltrates every aspect of our lives. It’s become a life support system without which we can’t survive. And yet, how much of it do we understand? Do I bother myself with the reality of what happens when I get into a big steel box, press a button, and rise into the sky?  Of course I don’t. I take going up the world like that for granted, we all do. And as the years of the 20th century have gone by the things we take for granted have multiplied way beyond the ability of any individual to understand in a lifetime.  The things around us, the man-made inventions we’ve provided ourselves with, are like a vast network, each part of which is interdependent with all the others.  (…) All the things in that network has become so specialized that only the people involved in making them understand them.

It continues with the contemporary example of the smartphone:

Let’s have a look at any object around us. For it to reach our hands, it has been necessary to exploit natural resources, submit it to complex manufacturing processes, distribute it through worldwide supply networks and validate it through international agreements and regulations of all kind. A big amount of our everyday acts -turn on the light, open a tap or take out the garbage- are not isolated events, but form part of a major system, altough we often ignore its scale and rarely have the chance to observe it as a whole. When we use a last generation smartphone in the middle of the street to look for the address of a restaurant, we are not only using the plastic and metal piece that we have in our hands but also activating a vast network that covers thousand of kilometres, formed by satellites in orbit, antennas set up in roofs and data centres that store information in anonymous locations.

Infrastractures are the support system of global society. Physical infrastructures (electric networks, pipelines, reservoirs) but also information (radio broadcasting, underwater cables) transport (sea routes, aerial routes) as well as legal and financial infrastructures that rule international trade and markets, as well as the hidden but active infrastractures that control the networks of drugs distribution or illegal immigration.

If we could contemplate the superposition of all of these infrastructures we could obtain an approximate representation of how a contemporary society works. Nevertheless, as citizens, we are often only conscious of those elements we are related with. Our field of action is determined by the rules that determine how these systems operate, and their functional limits How could we be conscious of them in order to understand them better?

This is a project that mammoth has long been interested in; my talk, “An Atlas of iPhone Landscapes”, begins with the subject matter of a post from last year, “a preliminary atlas of gizmo landscapes”, but will spiral outward from “the spatial trace and organizational logic of patterns of reception, broadcast, transmission, dissemination, production, and extraction” to encompass an array of wider concerns, from the role of the invisibility of infrastructural landscapes in the infrastructural public policy problem to re-industrialization to “the new aesthetic” of “cheap satellite imagery”.

I would, of course, love to meet any mammoth readers who are or will be in Madrid; the seminar is at MediaLab Prado and is, to the best of my knowledge, free and open to the public.

artificial crevasse


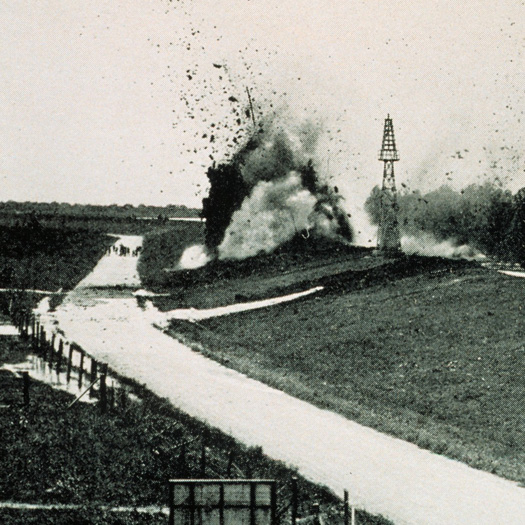
[Before the 1928 Flood Control Act, the Mississippi River flood control plan consisted of two basic elements: levees and outlets.  Earthern levees would hold the water back.  When necessary, outlets would be utilized to divert flood waters.  In an emergency, more levees could be created with sandbags; more outlets could be created by blowing levees up.  Here, a levee is dynamited to create an artificial crevasse — a crack or breach in a levee or dike — at Caernarvon, Louisiana, reducing pressure on levees in New Orleans.]

the mississippi river flood of 1927


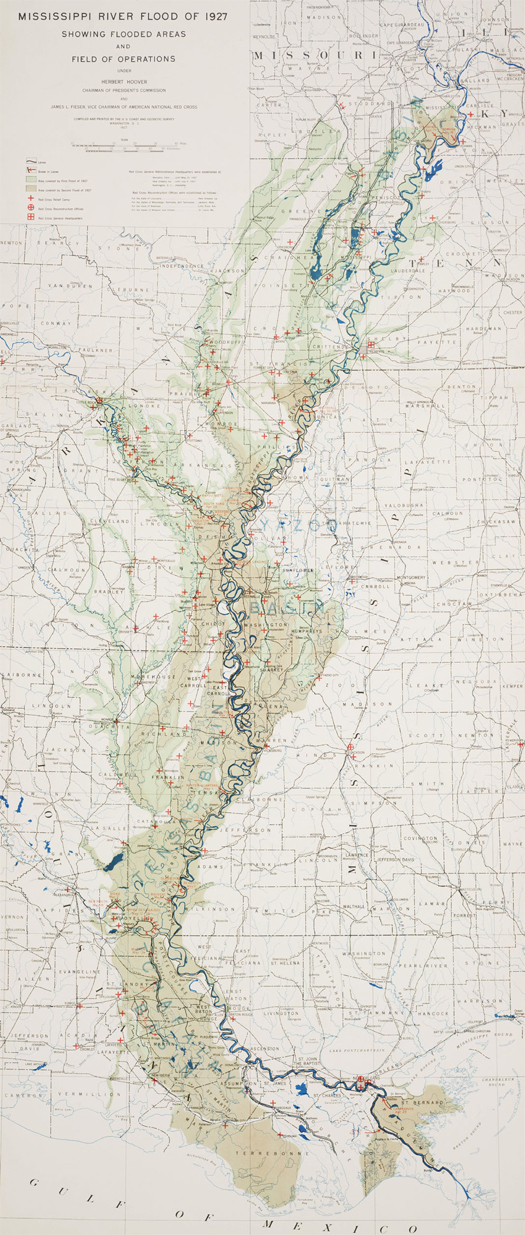
[Map prepared by the US Coast and Geodetic Survey (the fore-runner of today’s National Oceanic and Atmospheric Administration) in 1927, after the Great Mississippi Flood of that year.  The map shows “flooded areas and the field of operations”.  The great devastation produced by the 1927 flood — it flooded an area approximately equal to the entire area of New England, displacing nearly a million people —  prompted Congress to pass the 1928 Flood Control Act, which authorized the Army Corps of Engineers to survey, prepare flood control plans for, and erect bigger, stronger, more complex flood control infrastructures along the courses of the Mississippi, its tributaries, and the Sacramento River.  View the full-size map here.]

unusual flood typologies ii: scabland


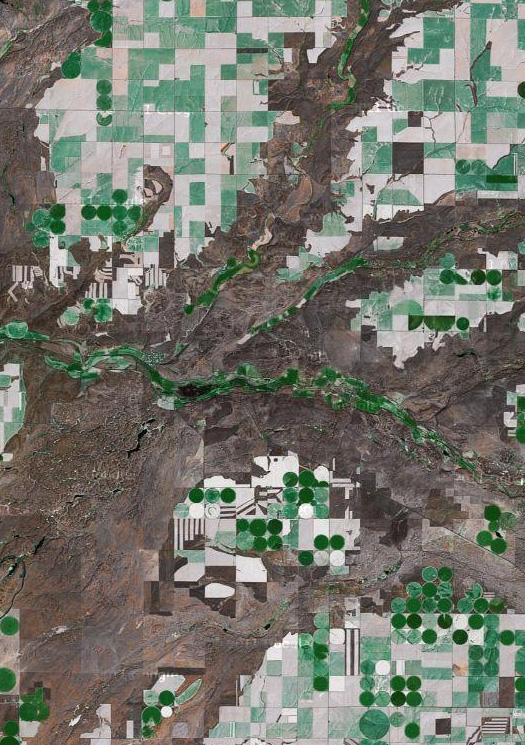
[The unusual agricultural pattern of eastern Washington’s “channeled scablands” can be traced to a (series of) massive glacial outburst flood(s) which cut the deep into the region’s volcanic basalt, leaving fertile plateaus and barren, rocky valleys.  Mammoth looked at that event, the Missoula Floods, in a post last year, “a glacier is a very long event”.  (You’ll want to scroll down to “Jokulhlaups”.)  We might add that, if contemporary land use patterns are determined by Ice Age floods, a flood can also be a very long event.]

suspension


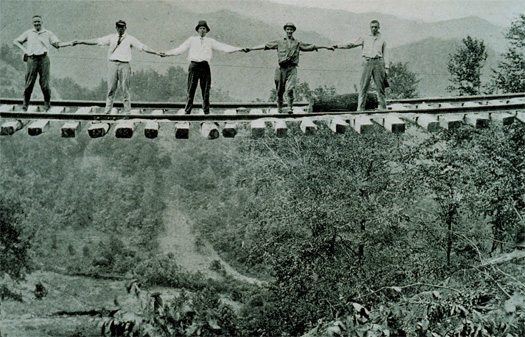
[In the summer of 1916, a pair of cyclones — one coming from the Gulf of Mexico and making landfall in Mississippi, the other coming from the Atlantic and landing in Charleston, South Carolina — poured torrential rains (“all previous 24-hour records for rainfall were exceeded”) across the southeast. Western North Carolina was hit especially hard. In this photograph from NOAA’s historic archives, men stand on a railroad track which was left suspended in mid-air after the fill material it rested on washed away.]

unusual flood typologies i: dam failure


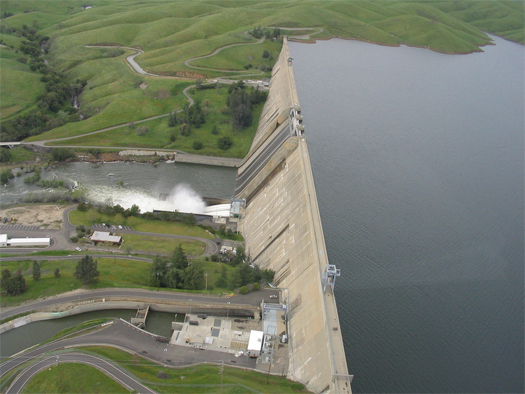
[Friant Dam, on the upper San Joaquin in California, filled to the top in spring of 2006.  Though the dam held, downstream flooding ensued.  When a dam does fail, as the Teton Dam did in 1976 or the Toccoa Creek Dam did in 1977, the flash-flooding that occurs can be deadly, resulting in relatively high death tolls for relatively small volume events.]

a century of significant floods

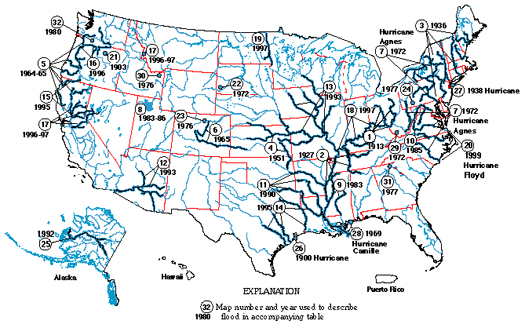
[“During the 20th century, floods were the number-one natural disaster in the United States in terms of number of lives lost and property damage. They can occur at any time of the year, in any part of the country, and at any time of the day or night. Most lives are lost when people are swept away by flood currents, whereas most property damage results from inundation by sediment-laden water. Flood currents also possess tremendous destructive power, as lateral forces can demolish buildings and erosion can undermine bridge foundations and footings leading to the collapse of structures.”

The USGS map above locates thirty-two of the most significant American floods of the 20th century, from the horrific inundation of Galveston during the Hurricane of 1900 (the deadliest natural disaster ever to strike the United States) to regional floods that struck across the United States in the nineties.  These floods are classified by cause, ranging from the most common — regional floods caused by heavy precipitation over a sustained period of time — to flash floods, storm-surge floods, dam- and levee-failure floods, and, rarest of all, ice-jam and mudflow floods.]

“waiting for the chute to open and the bull to come out bucking”


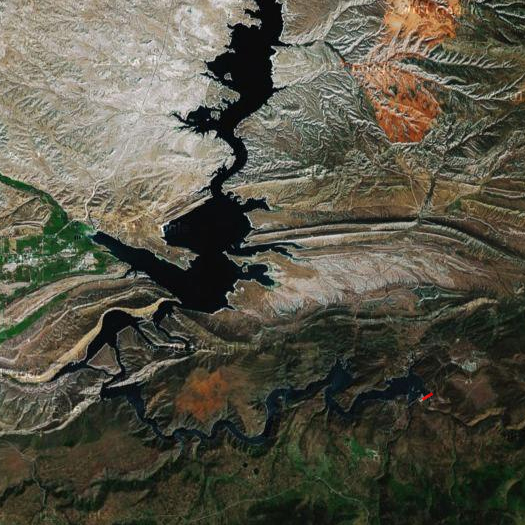
[Flaming Gorge Reservoir on the Green River in Utah; the reservoir’s primary dam is highlighted in red.  In anticipation of record summer floods, the reservoir’s waters are “being released as fast as [they] can flow”, making space in the reservoir to hold snowmelt.  Downstream, rafters are finding that typical rafting trips of two-and-a-half hours are shortened to a mere thirty minutes.]

As the month-long deluge ends and the Mississippi River flood crests (which is not at all the same as saying the flooding is ending), a separate flooding threat has quietly piled up in the Mountain West:

“Thanks to a blizzard-filled winter and an unusually cold and wet spring, more than 90 measuring sites from Montana to New Mexico and California to Colorado have record snowpack totals on the ground for late May, according to a federal report released last week. Those giant and spectacularly beautiful snowpacks will now melt under the hotter, sunnier skies of June — mildly if weather conditions are just right, wildly and perhaps catastrophically if they are not. Fear of a sudden thaw, releasing millions of gallons of water through river channels and narrow canyons, has disaster experts on edge.

…the West has changed significantly since 1983, when super-snows last produced widespread flooding. From the foothills west of Denver to the scenic, narrow canyons of northern Utah, flood plains that were once wide-open spaces have been built up. Many communities have improved their defenses, for example, by fortifying riverbanks to keep streams in place, but those antiflood bulwarks have for the most part not been tested by nature’s worst hits. And in sharp contrast to the floods on the Mississippi River — one mighty waterway, going where it will — the Western story is fragmented, with anxiety dispersed across dozens, perhaps even hundreds, of large and small waterways that could surge individually, collectively or not at all.”

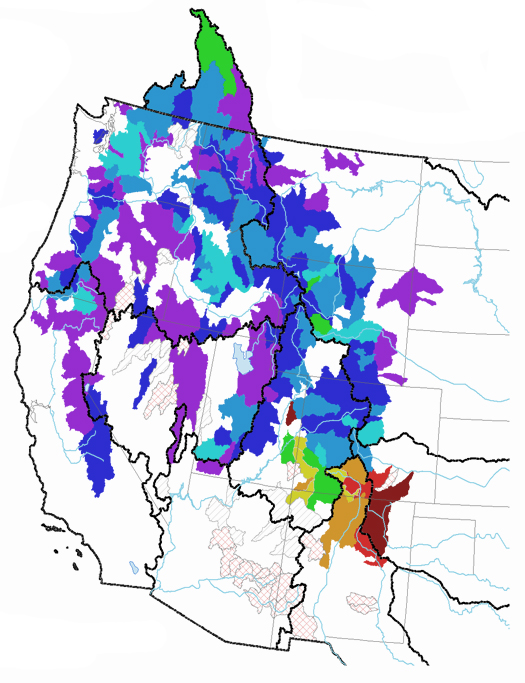
While spring floods have already inundated parts of the Mountain West, the massive pile-up of mountain snow has the potential to create another order of disaster.  Many, if not a majority, of Western snowpack measurement sites show twenty-year records.  A map from the National Water and Climate Center indicates the extremity of the condition:

Areas shown from light blue to purple possess snowpack at least 110 percent of average; purple indicates the greatest variation above average — 180 percent or more.  Randy Julander of the Natural Resources Conservation Service colorfully described the situation to the Seattle Post Intelligencer:

“At this point, everybody is just sitting back chewing fingernails and waiting because the longer it stays cold and wet, the worse it’s going to get…”

Julander said in a typical year the weather warms gradually, allowing snow in the mountains to melt slowly and ease into rivers and streams over time. That’s not the case this year.

“June is right around the corner and sooner or later, it’s going to warm up,” he said, noting that instead of gradually warming over eight to ten weeks, the West will likely see a rapid rise in temperatures heading into summer, a worst case scenario.

“And it’s not just Utah, Colorado and Wyoming. It’s basically all of the western states except Arizona and New Mexico,” Julander said. “We’re waiting for the chute to open and the bull to come out bucking, but he ain’t moving, yet.”

[Link to New York Times article via Nam Henderson.]