mammoth // building nothing out of something

atchafalaya ii: old river control


[The Auxiliary Structure at Old River Control; photographed by the Army Corps of Engineers, Team New Orleans.

Various circumstances have conspired to keep me from finishing the Floods series last week like I had hoped; there are still a few posts yet to come, and several of them will be part of this mini-series within a series, on the Atchafalaya Basin Project.  That project could, I think, be fairly described as the single most significant component of the entire Mississippi River flood control complex.  In truth, this is an interrupted series, which properly begins with a series of Atchafalaya-related posts from June: 1973, morganza floodway, and red river landing.  I’m going to try to avoid repeating things already explained in those posts, so if it feels like you’re missing something, you might check there.  If it still feels like you’re missing something, that’s probably just me writing poorly.]
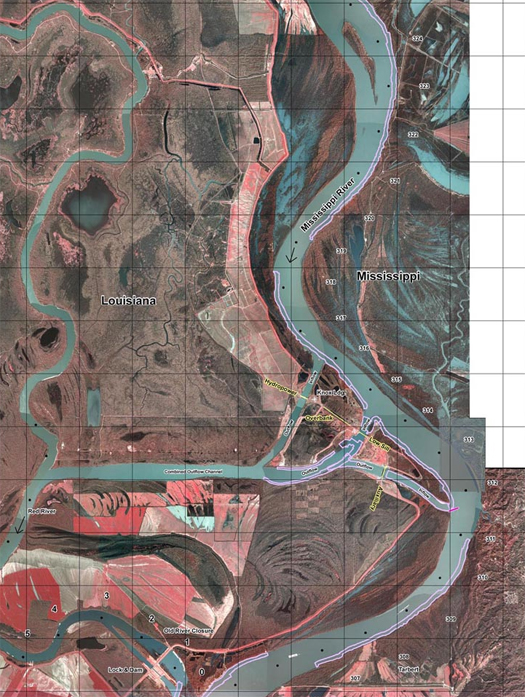
[Old River Control and Old River Lock, via the Army Corps of Engineers’ “Old River Hydraulic Sediment Response Model Study”.]

Old River is probably the most tense site of conflict between human engineering and the wild geomorphological tendencies of water in the United States, as it is here that the Army Corps fights the desire of the Mississippi River to switch its course into the Atchafalaya River and burn a faster, steeper path to the Gulf.  Between 1890 and 1950, the Atchafalaya captured an ever increasing volume of water from the Mississippi — ten percent in 1890, twenty in 1920, thirty in 1950.  This is because the Atchafalaya is roughly half the length of the Mississippi (measured from their point of convergence at Old River), and so it presents twice as steep a gradient.  There is nothing unusual about the desire of the Mississippi to shift courses; since sea levels stabilized after the end of the last glacial period, it has done so roughly every thousand years, spraying sediment around the Gulf to form Southern Louisiana.  In the time that the Mississippi has been on its present main course, though, it has been intensely urbanized — in 1950, New Orleans alone had over half a million citizens — and permitting it to shift has become unthinkable.

1 This proportion is technically not the proportion of water in the Mississippi, but what is known as “latitude flow” — all of the water that passes the latitude 30° 56′ 20.4″, “regardless of source or destination”.  This concept is readily communicated by this diagram.  (Confusingly, that latitude is the latitude of Red River Landing, which is a few miles downstream from Old River Control.)

Consequently, the Army Corps of Engineers was ordered to freeze, for apparent perpetuity, the proportional flow of the Atchafalaya and the Mississippi, as they existed in 1950: thirty percent down the Atchafalaya, seventy percent down the Mississippi1.

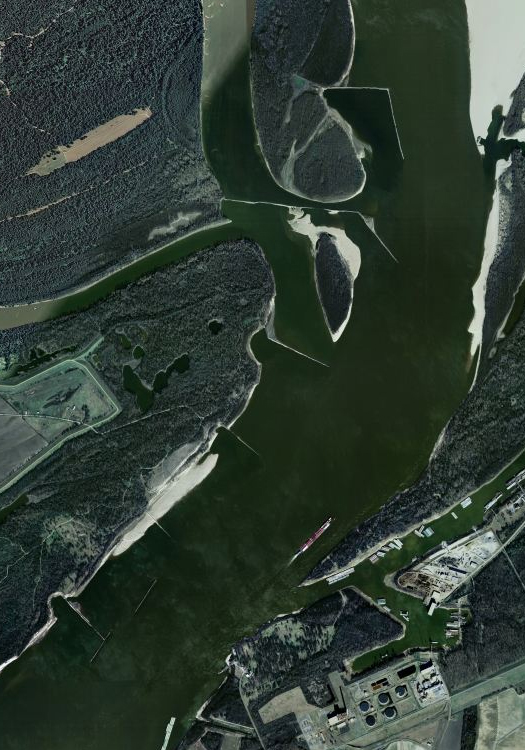
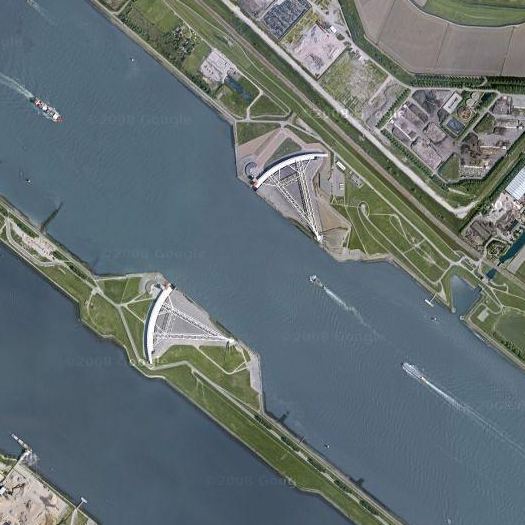
Old River Control is the primary product of that order: one hydroelectric plant — ancillary to the primary purpose of the structure — and two sills, massive weirs for regulating the flow of the river.  The higher sill is the Auxiliary Control Structure; it was completed in 1986, and is elevated above the normal level of the river, so that it serves as an additional release during extreme flood conditions.  The Low Sill, the primary component of Old River Control, was finished in 1963: eleven gates, each forty-four feet wide, on a weir nearly six hundred feet long.
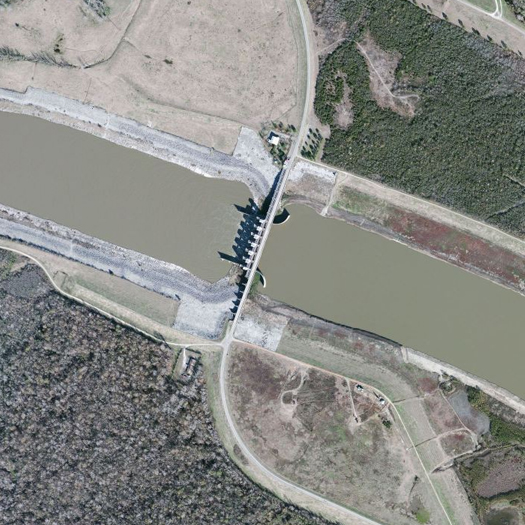

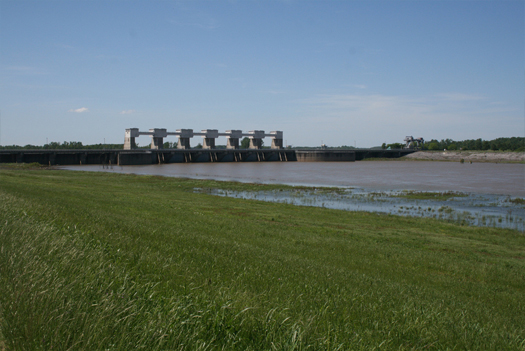
[The Auxiliary Control Structure.]
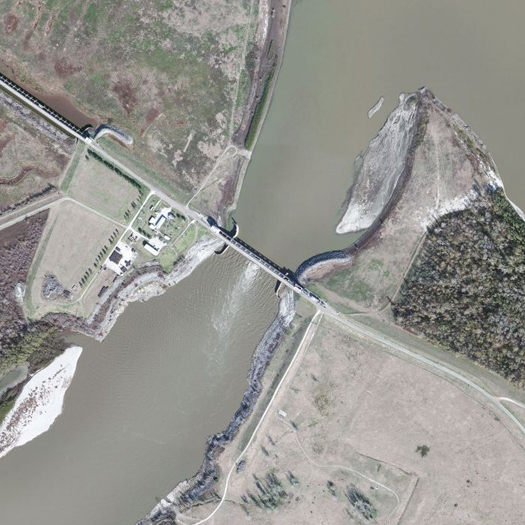

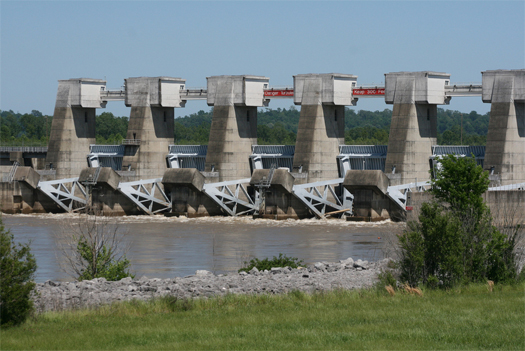
[The Low Sill.]
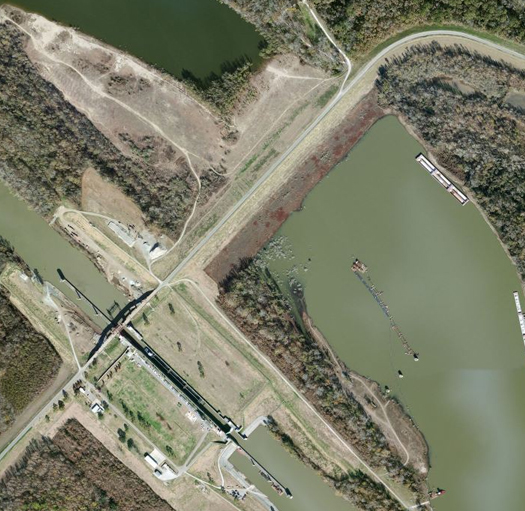

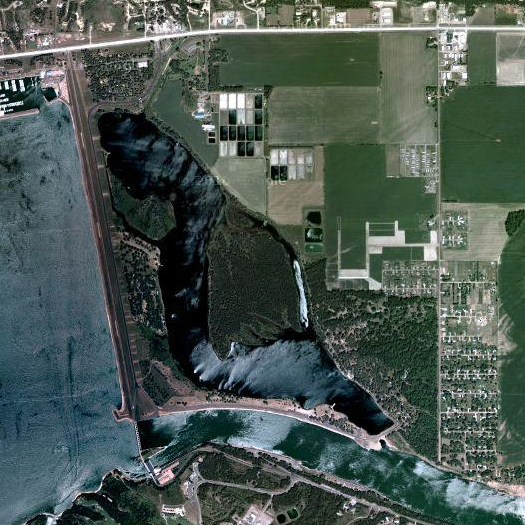
[Old River Lock, which permits navigation between the Mississippi, Red, and Atchafalaya Rivers, via Old River.  These three images are via Bing Maps and to the same scale.]

The primary impetus for the construction of the Auxiliary Control Structure was an extraordinary event during the infrastructure-straining flood of 1973, which nearly destroyed the Low Sill — and almost set the Mississippi free down the course of the Atchafalaya.  John McPhee’s classic narrative of the struggle between the Army Corps of Engineers and these two rivers, “Atchafalaya”, tells the story of that event.  It may seem like I am quoting at extreme length — I suppose that I am — but the full piece is much, much longer, and well-worth reserving a few hours to read.  At any rate, “Atchafalaya”:

“In mid-March [1973], when the volume began to approach that amount, curiosity got the best of Raphael G. Kazmann, author of a book called “Modern Hydrology” and professor of civil engineering at Louisiana State University. Kazmann got into his car, crossed the Mississippi on the high bridge at Baton Rouge, and made his way north to Old River. He parked, got out, and began to walk the structure. An extremely low percentage of its five hundred and sixty-six feet eradicated his curiosity. “That whole miserable structure was vibrating,” he recalled in 1986, adding that he had felt as if he were standing on a platform at a small rural train station when “a fully loaded freight goes through.” Kazmann opted not to wait for the caboose. “I thought, This thing weighs two hundred thousand tons. When two hundred thousand tons vibrates like this, this is no place for R. G. Kazmann. I got into my car, turned around, and got the hell out of there. I was just a professor—and, thank God, not responsible.”

…Nowhere in the Mississippi Valley were velocities greater than in this one place, where the waters made their hydraulic jump, plunging over what Kazmann describes as “concrete falls” into the regime of the Atchafalaya. The structure and its stilling basin had been configured to dissipate energy—but not nearly so much energy. The excess force was attacking the environment of the structure. A large eddy had formed. Unbeknownst to anyone, its swirling power was excavating sediments by the inflow apron of the structure. Even larger holes had formed under the apron itself. Unfortunately, the main force of the Mississippi was crashing against the south side of the inflow channel, producing unplanned turbulence. The control structure had been set up near the outside of a bend of the river, and closer to the Mississippi than many engineers thought wise.

On the outflow side—where the water fell to the level of the Atchafalaya—a hole had developed that was larger and deeper than a football stadium, and with much the same shape. It was hidden, of course, far beneath the chop of wild water. The Corps had long since been compelled to leave all eleven gates wide open, in order to reduce to the greatest extent possible the force that was shaking the structure, and so there was no alternative to aggravating the effects on the bed of the channel. In addition to the structure’s weight, what was holding it in place was a millipede of stilts—steel H-beams that reached down at various angles, as pilings, ninety feet through sands and silts, through clayey peats and organic mucks. There never was a question of anchoring such a fortress in rock. The shallowest rock was seven thousand feet straight down. In three places below the structure, sheet steel went into the substrate like fins; but the integrity of the structure depended essentially on the H-beams, and vehicular traffic continued to cross it en route to San Luis Rey.

Then, as now, LeRoy Dugas was the person whose hand controlled Old River Control—a thought that makes him smile. “We couldn’t afford to close any of the gates,” he remarked to me one day at Old River. “Too much water was passing through the structure. Water picked up riprap off the bottom in front, and rammed it through to the tail bed.” The riprap included derrick stones, and each stone weighed seven tons. On the level of the road deck, the vibrations increased. The operator of a moving crane let the crane move without him and waited for it at the end of the structure. Dugie continued, “You could get on the structure with your automobile and open the door and it would close the door.” The crisis recalled the magnitude of “the ’27 high water,” when Dugie was a baby. Up the valley somewhere, during the ’27 high water, was a railroad bridge with a train sitting on it loaded with coal. The train had been put there because its weight might help keep the bridge in place, but the bridge, vibrating in the floodwater, produced so much friction that the coal in the gondolas caught fire. Soon the bridge, the train, and the glowing coal fell into the water.

One April evening in 1973—at the height of the flood—a fisherman walked onto the structure. There is, after all, order in the universe, and some things take precedence over impending disasters. On the inflow side, facing the Mississippi, the structure was bracketed by a pair of guide walls that reached out like curving arms to bring in the water. Close by the guide wall at the south end was the swirling eddy, which by now had become a whirlpool. There was other motion as well—or so it seemed. The fisherman went to find Dugas, in his command post at the north end of the structure, and told him the guide wall had moved. Dugie told the fisherman he was seeing things. The fisherman nodded affirmatively.

When Dugie himself went to look at the guide wall, he looked at it for the last time. “It was slipping into the river, into the inflow channel.” Slowly it dipped, sank, broke. Its foundations were gone. There was nothing below it but water. Professor Kazmann likes to say that this was when the Corps became “scared green.” Whatever the engineers may have felt, as soon as the water began to recede they set about learning the dimensions of the damage. The structure was obviously undermined, but how much so, and where? What was solid, what was not? What was directly below the gates and the roadway? With a diamond drill, in a central position, they bored the first of many holes in the structure. When they had penetrated to basal levels, they lowered a television camera into the hole. They saw fish.

The damage at Old River was increased but not initiated by the 1973 flood. The invasive scouring of the channel bed and the undermining of the control structure may actually have begun in 1963, as soon as the structure opened. In years that followed, loose barges now and again slammed against the gates, stuck there for months, blocked the flow, enhanced the hydraulic jump, and no doubt contributed to the scouring. Scour holes formed on both sides of the control structure, and expanded steadily. If they had met in 1973, they might have brought the structure down.

After the waters quieted and the concrete had been penetrated by exploratory diamond drills, Old River Control at once became, and has since remained, the civil-works project of highest national priority for the U.S. Army Corps of Engineers. Through the surface of Louisiana 15, the road that traverses the structure, more holes were drilled, with diameters the size of dinner plates, and grout was inserted in the cavities below, like fillings in a row of molars. The grout was cement and bentonite. The drilling and filling went on for months. There was no alternative to leaving gates open and giving up control. Stress on the structure was lowest with the gates open. Turbulence in the channel was commensurately higher. The greater turbulence allowed tho water on the Atchafalaya side to dig deeper and increase its advantage over the Mississippi side. As the Corps has reported, “The percentage of Mississippi River flow being diverted through the structure in the absence of control was steadily increasing.” That could not be helped.

After three and a half years, control was to some extent restored, but the extent was limited. In the words of the Corps, “The partial foundation undermining which occurred in 1973 inflicted permanent damage to the foundation of the low sill control structure. Emergency foundation repair, in the form of rock riprap and cement grout, was performed to safeguard the structure from a potential total failure. The foundation under approximately fifty per cent of the structure was drastically and irrevocably changed.” The structure had been built to function with a maximum difference of thirty-seven feet between the Mississippi and Atchafalaya sides. That maximum now had to be lowered to twenty-two feet—a diminution that brought forth the humor in the phrase “Old River Control.” Robert Fairless, a New Orleans District engineer who has long been a part of the Old River story, once told me that “things were touch and go for some months in 1973” and the situation was precarious still. “At a head greater than twenty-two feet, there’s danger of losing the whole thing,” he said. “If loose barges were to be pulled into the front of the structure where they would block the flow, the head would build up, and there’d be nothing we could do about it.”

Read the full piece in the New Yorker’s archive; it can also be found in one of McPhee’s books, The Control of Nature.

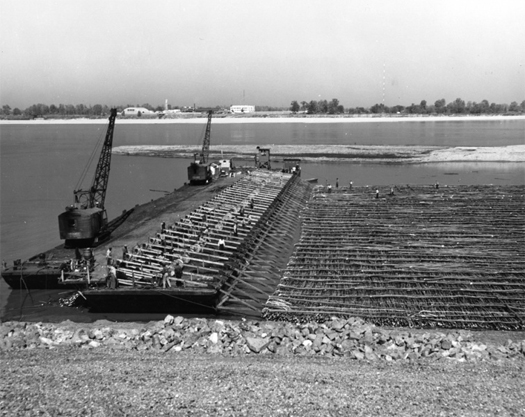
willow fascine mattress


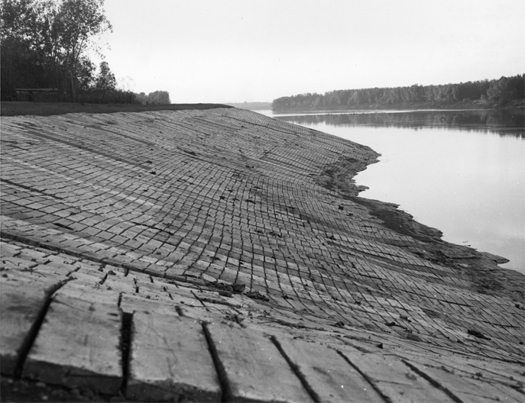
[Before the use of articulated concrete mats was standardized, the Army Corps often relied on a variety of other methods of revetment construction.  The weaving and placement of willow fascine mattresses, as seen above, was one such earlier practice; the installation process is remarkably similar to and prefigures the process for concrete mats.  Images via the Public Library of Cincinnati and Hamilton County.]

casting fields


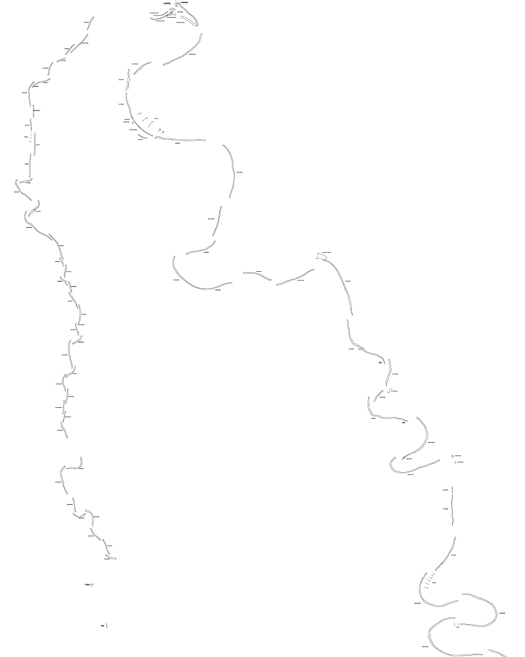
[Map of revetments under the purview of the Army Corps of Engineers’ Team New Orleans, on the Mississippi and Atchafalaya Rivers; image produced by mammoth using data from the Army Corps.]

I’ve already talked a fair about the idea that the Mississippi River is, at this point in its history, an artificially-constructed system that should be understood as a hybrid of infrastructural and natural forces.   So far, though, I’ve explained this primarily in macroscope terms, such as by noting that the flow rates of the river are artificially bounded and increased, or that the position and magnitude of flood events are produced by a confluence of natural forces, politics, and engineering — the river overlaid by “a diagram with… persistent instrumental effect”, in Brett Milligan’s apt description.


[Zooming in further on Atchafalaya and Mississippi revetments.]

1 A quick survey of the Army Corp’s Team New Orleans website indicates that virtually every mile of the Mississippi’s banks within that team’s purview — 361 miles or so in total — has been at least partially covered by revetments.  Both the Vicksburg District’s River Operations Branch and the St. Louis District’s Applied River Engineering Center also lay revetments.

The Mississippi, though, is also materially artificial, to a degree that may be quite surprising and, frankly, intensely weird.  The entire lower reach of the Mississippi has undergone the process of “channel stabilization”, which includes dredging (to improve navigability and maintain consistent channel depth), building dikes, providing cutoffs (artificially dug straight paths for the river which anthropogenically accelerate the production of oxbow lakes), and, most importantly for the alteration of the river as a channel of sedimentary material, the construction of “revetments” on the majority of the river’s banks1.


[Revetment mapping, close-up.  The extent of the material application of the concrete mats — the sheer scale of the transformation of the Mississippi from a soft system in perpetual erosive motion to a semi-hard system, locked in place — can be felt in the completeness of the trace of the river’s form.]


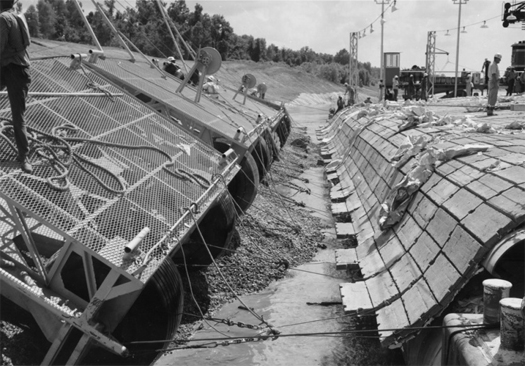
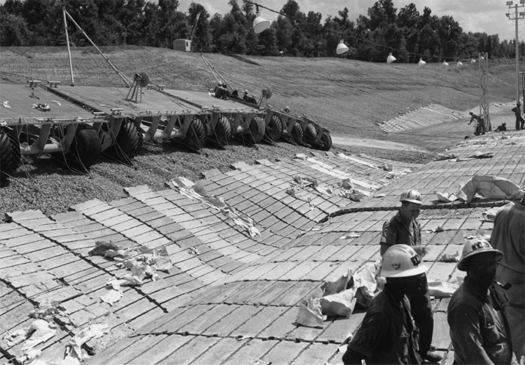
[Constructing the Goldbottom revetment in Mississippi, 1964; images via the Public Library of Cincinnati and Hamilton County.]


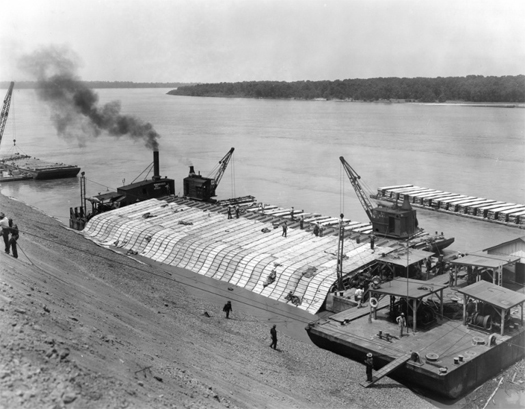
[Lowering a revetment onto the “subaqueous stream bank” near Memphis, Tennessee; via the Public Library of Cincinnati and Hamilton County.]


[A finished revetment in Kentucky; via the Public Library of Cincinnati and Hamilton County.]

The revetments seek to freeze a specific temporal and spatial moment in channel migration for apparent perpetuity, encasing soft earth in hardened cement and aggregate; they are most often placed on the outside banks of bends in the river, where the erosive action of riverwater is concentrated.  (In alluvial flood plains, like the Mississippi’s, rivers are ever migrating (meandering) towards their outside bends, producing “cut banks”, while depositing material on their inside edges, producing “point bars”.)

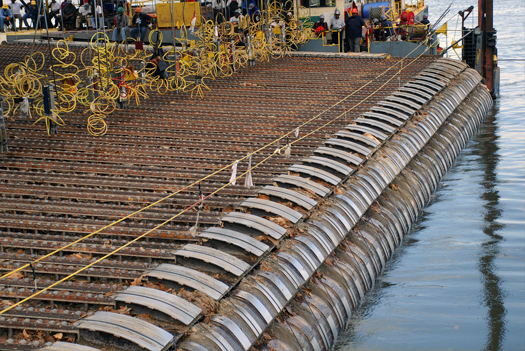
In Mississippi River channel stabilization, these revetments are most typically constructed out of “articulated concrete mattresses”, vast mats of interlocked concrete blocks which are laid onto banks by special “launching barges”.


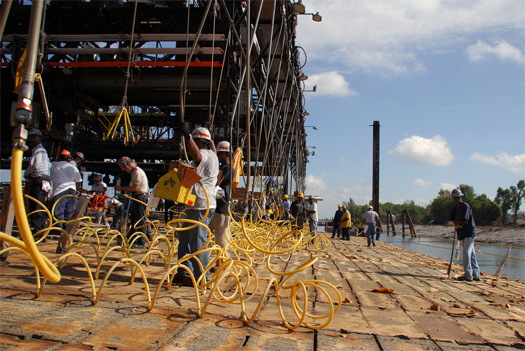
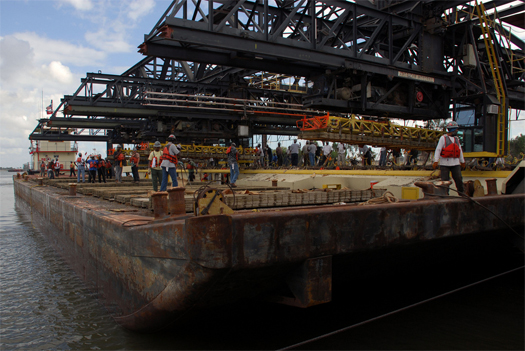
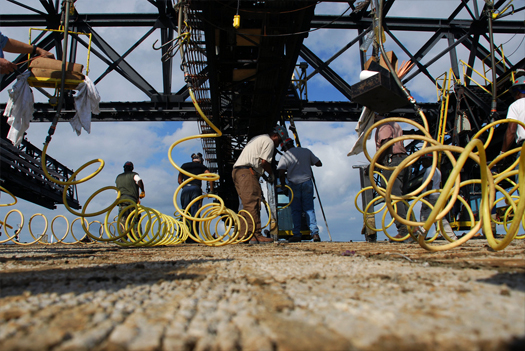
[The “Mat Sinking Unit”, in operation, Fall 2010.]

The Army Corps of Engineers describes the operations of the “Mat Sinking Unit”, the Vicksburg District’s mat launching barge:

“Each autumn the Mat Sinking Unit, with over 350 employees, begins several months of work on the Mississippi River for the annual construction program of establishing permanent locations for the constantly moving river banks using flexible concrete blankets. The designers allow the river to eat away at the banks until they arrive at the desired position and at that point, they are fixed in place…

Mat sinking is not an 8-to-5 job, but rather, seasonal work conducted during the traditional low water months of August, September, October and November. When the workers leave Vicksburg on the quarter boats, compared by some to a large, floating hotel, their work season consists of 10-hour shifts for 12 consecutive days with two days off. This mat sinking operation is a unique river operation and is the only one of its kind in the world.

The articulated concrete mattress (mat) arrives on location by barge from one of the mat-casting fields along the river in Tennessee, Arkansas, Mississippi and Louisiana. A fleet of 50 mat supply barges, some loaded and on location and some empty and awaiting loading by the mat-loading crew at the casting field, are towed up and down the river by Corps or contract boats.

On location, the mooring barge and spar barge are perpendicular to the shore and the work barge (mat boat) is parallel to shore and tied off to the mooring barge. The work boat positions a supply barge to be tied off to the back of the mat boat and the mat-laying operation is ready to begin.

The four overhead cranes move the 16-block sections of mat from the supply barge across to the mat boat where workers, using a pneumatic “mat-tying” tools, wire the sections together and connect to 3/8-inch launching cables running from the mat boat to the bank. The 4- by 25-foot sections (squares) are tied together with 35 other squares to form one launch. A typical blanket of mat will consist of from 12 to 24 launches. Each supply barge holds 585 squares of mat, consisting of 950 tons of concrete.

In order to get the mat anchored firmly on the bank, anchors are driven in the ground. The crew will hook the mat cables to dozers (tractors) waiting on shore that serve at temporary anchors. The mat boat will then move away from the bank launching the concrete mattress in the process. The mat boat can move riverward [along the] mooring barge and then spar barges are utilized to allow the mat boat to continue out for the remainder of the channel mat length. The entire plant moves upstream… and begins the first launch of a new channel mat.”


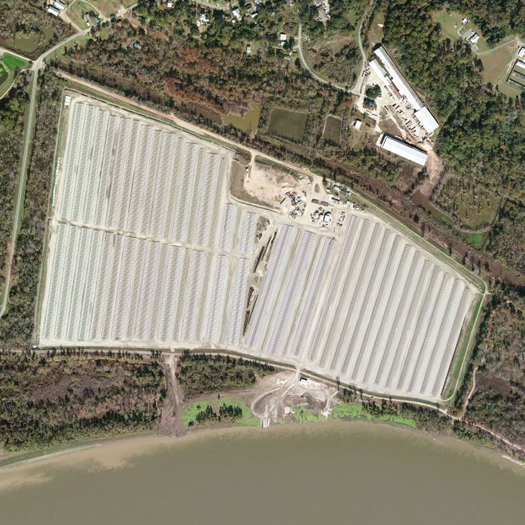
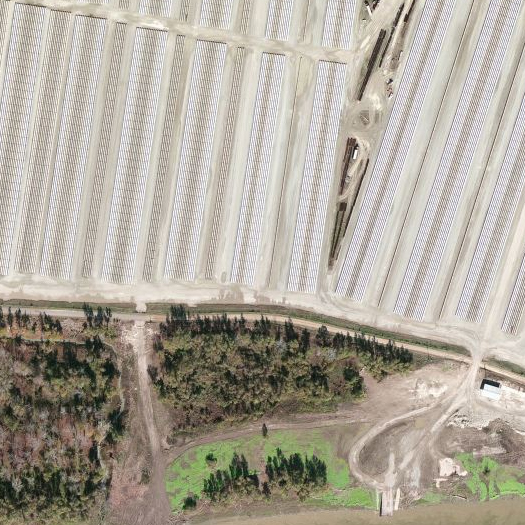
[The St. Francisville Casting Fields, via Bing Maps.]

The blocks for these articulated mattresses are cast at several locations along the Mississippi River, such as the Army Corps’ St. Francisville Casting Fields, an obscure facility in West Feliciana Parish, Louisiana, composed of a dock (where the barges are loaded) and the 210-acre casting field, from which the Army Corps accomplishes the exceptionally bizarre task of creating and exporting artificial banks for America’s greatest river, in a fascinatingly quick and hard anthropogenic twist on the processes of sedimentation which slowly form natural river banks.  A couple more of these fields of future river bottoms, which are spread throughout Louisiana, Arkansas, Mississippi, and Tennessee, can be found on the Mississippi Floods map.

hamburg, iowa (2)


[Flooding on the Missouri River, up and downstream from Hamburg, Iowa.  The distinct spray pattern produced by burst levees is visible in at least three locations, while the raised outline of the emergency Ditch 6 levee can be seen on the western edge of Hamburg, protecting the city from the insistent floodwaters.  Imagery captured by NASA’s Earth Observing satellite, EO-1, on 17 July 2011.]

a quick and unnecessary defense of density against some chart

Grist recently cross-posted an article by Per Square Mile’s Tim De Chant which mines an old (2009) study from the Journal of Urban Economics to argue that “only the steepest increases in density could reduce car usage”.  Unfortunately, I think that’s entirely the wrong conclusion to draw from the study.

Here’s the key graph that De Chant writes about:

And here’s why I think De Chant is drawing faulty conclusions:

A. “VMT only really declines substantially at the highest housing density—over 5,000 units per square mile, or about the same as Chicago.”

1 Because most international population density data is in people per square mile, rather than households, I’m using the 2.6 people/household figure De Chant uses to roughly translate between the two.

There is no reason that the graph should stop at 5,000 units per square mile.  New York City — not ultra-dense Manhattan, but the city as a whole — is nearly double that1.  (It seems really odd to me to not include a datapoint for New York City on a chart about American urban density.)   Major European cities (Paris, Athens, Barcelona, etc.) are twice that again.  And global megacities (Cairo, Manila, many cities in countries like India and Indonesia, etc.) are even denser, three to even four times the density of New York City.  Even if you throw out those cities as unacceptably dense (though I wouldn’t, at least without defining unacceptably), it’s hard to argue that Paris or Barcelona aren’t pretty desirable places to live.  You can make the argument that such density is so unrealistic that it shouldn’t be a goal for American urbanists, but if you’re trying to quantify the value of various kinds of density, it’s bizarre to not even talk about the options.

B. “To halve VMT of the highest mileage households, you would need to increase housing density in those areas by 20- to 100- fold.”

In other words, to reduce the VMT of households in rural West Virginia, you would need to increase density in those areas to Chicago levels.  But no urbanist I’m familiar with is talking about turning West Virginia into Chicago.  Urbanists are interested in things like densifying inner-ring suburbs, or removing restrictions on new construction in already-dense areas.  In the context of the chart, moving people from the fourth column to the fifth, or from the fifth off the chart.  Yes, those are still difficult things to do, but they’re not absurd like the 20-to-100-fold increase De Chant describes.

C. The most important (and most wrong) argument in the piece is this: “Density is responsible for a fraction of annual VMT”.

This is literally not what the chart shows.  The chart indicates — predictably — that moving from a typical built-up suburb (density of 1000-3000 hh/sq.mi.) to the only portion of the chart that actually qualifies as significant density (>5000 hh/sq.mi.) nearly halves VMT.  If the chart were extended to the right to show further densities — New York City’s, European, global — then I predict (I am going out on a limb here) that it would continue to decline.  Signficantly.  (I feel pretty safe in further assuming that the decline would not be linear, but increase rapidly as you reach densities at which car travel becomes less and less practical.)

SF.Streetsblog posted a short item from Peter Calthorpe early this year which discussed the extremity of variance in VMT between neighborhoods in the San Francisco region.  I’ll quote a piece of it:

“…a typical household in the Russian Hill neighborhood of San Francisco has an average VMT of 7,300 miles a year. This neighborhood averages only three stories but is dense by suburban standards; has a rich mix of shops, restaurants, and services within walking distance; and is a short transit ride from downtown…

The Rockridge neighborhood in Oakland was created as a streetcar suburb back in the prewar days of the Key Route Trolley system, which connected most of the Bay Area until 1948. It is filled largely with bungalow and small-lot single-family homes but has small apartment buildings at corners and a wonderful mixed-use main street along with a BART (Bay Area Rapid Transit) train station at its center. The average household there drives about 12,200 miles a year… Out in San Ramon, a low-density East Bay suburb without good transit connections, development patterns fit the standard sprawl paradigm, with isolated single family subdivisions, strip commercial arterials, malls, and office parks. VMT for the average home there is around 30,000 miles a year…

So there is a four-to-one range in travel behavior over three neighborhoods in one region.”

While the plural of anecdote is not necessarily data, I see nothing in the chart De Chant posted which would indicate that Calthorpe’s examples are outliers.

D. All that said, here’s what I can agree with De Chant on — increasing fuel economy is an extremely important project and densification is a slow, long-term project.  (mammoth has always argued for the importance of appreciating the slowness of change in urban systems.)  But bad interpretations of poorly-framed charts are only going to make the latter more difficult, and that’s why De Chant’s post is particularly unfortunate.

[If you’ve been reading mammoth for a while, you’ll probably think this is kind of an odd post, given our frequent arguments for the importance of understanding, working with, and valuing the American suburb.  We like to hold these things in tension — esteem for the virtue of dense, urban living and an appreciation of both the many reasons that Americans have traditionally valued suburban living and the strange vitality of the suburbs as the United States’ most iconic urban form.]

dike field


[A dike field in the Mississippi River near Greenfield, Mississippi; via bing maps.]

In the Mississippi River, dike fields are constructed in order to direct the river’s flow to a central channel, scouring it and reducing the need for dredging.  Though their primary purpose is to thus maintain navigability for shipping, dike fields tend, as a side-effect, to produce useful habitat, through both the creation of low-velocity zones (‘dike field pools’) within the river (various fish and invertebrate species favor different river velocities at different points in their life cycles) and through sedimentation behind the dikes — the sandbars thus produced are often of great value for waterfowl.

Mississippi River blogger Quinta Scott describes one particularly fascinating dike field incident, an Army Corps re-design of a dike field near St. Louis, which had succeeded in producing a sand-bar, but a sand-bar which was dry and lacking the associated side-channels which birds and fish favor:

“Using an aerial photograph, the engineers built a scale model of the dike field and studied various alternatives for scouring new side channels along the east bankline and creating aquatic depth and diversity for fishes, creating an island between the side channel and the navigation channel, and creating a reliable navigation channel next to the island. They tried raising the dikes; widening and narrowing the notches dike; increasing and decreasing the number of notches in each dike; increasing and decreasing the height of the notches over the Low Water Reference Plane; subtracting and adding dikes to the field and adding dikes to the opposite bank.

They tested each new configuration. Would it create a self-sustaining side channel? Would it create a high elevation island within the dike field? Would it increase the depth of the navigation channel? Of the fourteen configurations they tested, three filled the bill. One created a good side channel, but a small dike in the field would interfere with barge fleeting. A second created a good navigation channel, but the side channel would be too shallow. The third worked. The small dike was removed and therefore did not interfere with barge fleeting, but the notches created a continuous side channel between five and ten feet deep at low water for fish and a nicely isolated, 190-acre island for the terns.”

This is experimental landscape architecture, testing various infrastructural hacks through the construction and modification of physical models.  (Yet another example of why the Army Corps is — despite the bureaucratic language it cloaks its practice in — such a radical landscape organization.)  A bit more of this sort of experimentation with fluid and granular dynamics — and a bit less second-rate aping of mediocre parametricism — might be quite good for the profession.

flooding, previously

As I’m gathering projects, proposals, practices, and places to be covered before I wrap up our summer flood-blogging extravaganza (which I expect to do by the end of the month), I thought it worth looking back at a handful of notable posts from mammoth‘s past that concerned flooding.  Hopefully some of these, since they are primarily from mammoth‘s first couple months, will be new to readers.  In no particular order:

1. below the phreatic level

“In 1998, Mexican architect Alberto Kalach and his colleague Teodoro Gonzalez de Leon published La Ciudad y sus Lagos, a bold proposal that examined the potential resurrection ofLake Texcoco, the largest of the lakes which Mexico City’s predecessor Tenochtitilan was founded on. The revitalization of the lake would serve to both benefit Mexico City ecologically and to invigorate the practice of urbanism in Mexico.

The idea behind the Lakes Project descends from a report written by a soils expert and professor, Nabor Carillo, in the 1960s. Carillo held that the centuries of attempts to drain the lakes of Mexico City (intiated by the Spaniards shortly after conquering Tenochtitilan) were in error.  Those centuries of efforts — perhaps most impressively represented by the 1789 completion of the Nochistongo ravine and the networks of canals such as Huehuetoca — had left Mexico City lying below the phreatic level (the natural surface of the static water table) and consequently in constant state of war with floodwaters.  Carillo’s program was radical because, rather than continuing and expanding efforts to funnel water away from the city, he suggested ‘reconstructing the city’s original lakes as natural detention ponds for controlled flooding and containment of treated wastewater’.”

2. bulwarks and flux

“Louisiana senator Mary Landrieu, returning from a tour of the Netherlands’ coastal armaments, says America needs to “rethink its entire approach to low-lying coastal areas and adopt an integrated model of water management like that of the Netherlands”…

Landrieu explains that the Dutch system is superior both in its integration into the landscape — as mentioned above, parks and open spaces serve as flood reservoirs, while the more modern portions of the Dykeworks are designed to allow the mixing of fresh and salt water that sustains fragile estuary habitat — and sheer weight of structure dedicated to firming the line between sea and land. Perhaps this seems slightly paradoxical, as this implies at once acknowledgement of the necessity of accepting the ambiguity of the relationship between land and water at the coast (which is not so much a line as an average drawn from unstable data points) and a far more serious effort at crystallizing that line through the construction of megastructures. But the flexibility to hold these two contradictory stances in tension maybe exactly the flexiblity that the Army Corps of Engineers needs to develop. The Dutch example may even suggest that an architecture of flexible insertions that reprogram the radical flux of natural systems and an architecture of mammoth bulwarks against that radical flux are not wholly incompatible.”

3. its prettiness and romance will then be gone

“As long as I’m on the subject of urban parks that serve as components of flood management systems, I ought to mention the recent Buffalo Bayou Promenade in Houston, which is not only an admirable and forward-thinking project from a city not known for its innovative ecological design (though they have built a rather seductive tangle of on and off ramps), but also manages to mash three of my favorite things — urban parks, flood control and freeway interchanges —into the same space.”

4. the new dutch water defense line

“The original Dutch Water Line (whose function and mechanism can be easily dervied from the variables in the English translation, “inundation line” and “water defense line”) dates to 1629, when Prince Frederick Henry, inspired by the successful use of flooding as a defense mechanism during the Dutch War of Independence, began to execute a plan to construct a “line of flooded land protected by fortresses”.

This national defense system of weaponized artificial hydrology proved remarkably successful during the 17th century, halting Louis XIV’s invasion of the Netherlands, but less so in the 18th, when the French took advantage of winter ice to bypass the Water Line.

The idea of weaponized hydrology was firmly ensconced in the national consciousness, though, and, after the formation of the United Kingdom of the Netherlands in the early 19th century solidified national borders, the Nieuwe Hollandsche Waterlinie was constructed to the east of the original Waterlinie. Between three and five kilometers wide, the zone of potential inundationstretched “approximately 70 kilometres from Muiden (situated on the Zuiderzee, currentlyYsselmeer), past the city of Utrecht towards the east, down to the large river district (the Nieuwe Merwede) and the Biesbosch,” at a depth of 35 to 50 centimeters (just deep enough to prevent crossing with artillery, but not deep enough for boats) — approximately one hundred and seventeen thousand cubic meters of ominously empty space, imbued with military potential.”

5. staging ground

“‘Staging Ground’ is the thesis project of recent Harvard GSD graduate Andrew tenBrink.  In it, tenBrink explores a series of topics which make frequent appearances at mammoth: delta urbanism (in this case, the inverted Sacramento-San Joaquin River Delta of central California), climate defense systems (here, levees, polders, dikes, and weirs), post-natural ecologies, and, perhaps most pertinently, what tenBrink calls ‘the agency of infrastructure’.”

[Full image credits can be found in each of the referenced posts.]

the waterways experiment station


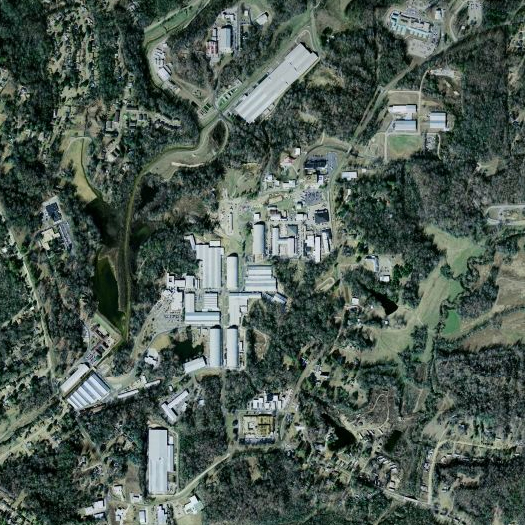
[The Waterways Experiment Station, in Vicksburg, Mississippi, is currently the home of the Army Corp’s Coastal and Hydraulics Laboratory.  (It also is the entity which operated the Mississippi Basin Model, and the research into flood control and river hydrology which was once conducted physically on that model and its sister models is now conducted, primarily through computer simulations, at the Coastal and Hydraulics Laboratory.)  The Coastal and Hydraulics Laboratory is one of seven USACE research posts, from the Cold Regions Research and Engineering Laboratory to the Topographic Engineering Center, which cumulatively compose a distributed network for landscape science known as the Engineer Research and Development Center.  If the Army Corps of Engineers can be understood as “the country’s most radically avant-garde landscape practice”, then that network of research posts should be understood as one of the key elements in that practice, as it is within those seven compounds that they analyze, experiment, and predict.]

san francisco bay model

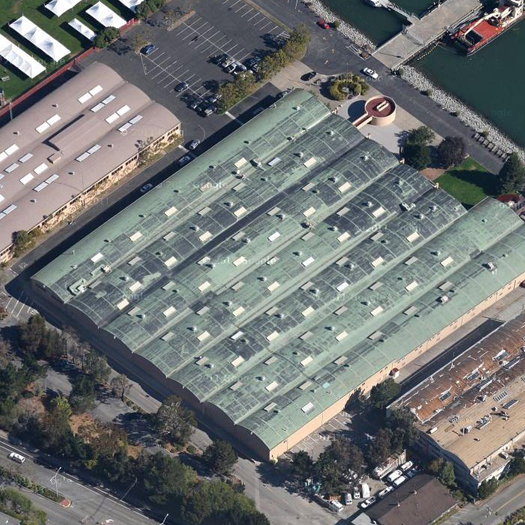
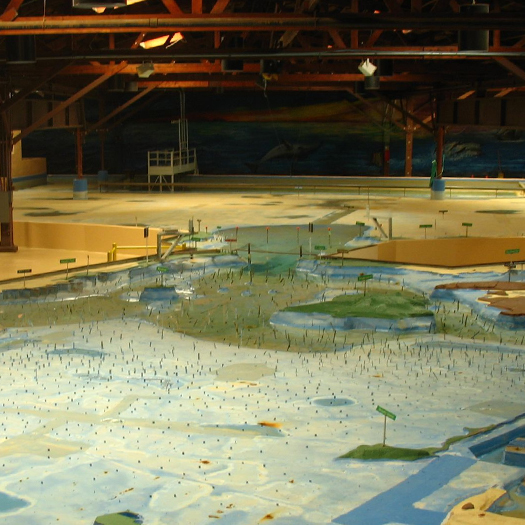
The San Francisco Bay Model was, like the Mississippi Basin Model, built by the Army Corps of Engineers to study the flow of water — in this case, simulating “the rise and fall of tide, flow, and currents of water, mixing of salt and fresh water, and… trends in sediment movement”, permitting the study of the impact of both natural events (such as floods) and human actions (such as dredging and industrial accidents).  It is also, again like the Mississippi Basin Model, out of service, not having been used for active modeling since 2000, though — unlike the Mississippi Basin Model — it has found a second life as a public education center, open to guided and unguided public tours.

The San Francisco Bay Model is the only model of its size which remains intact and functional.  (There were originally three comparable models built by the Army Corps, with the San Francisco and Mississippi Models joined by the Chesapeake Bay Model on Kents Island, MD.  The Chesapeake Bay Model ran its last test in 1982 — successfully predicting the watery resting place of the body of the final victim of the Air Florida Flight 90 crash — and today occupies a mostly empty lot in Matapeake State Park.)  Interestingly, the reason that the San Francisco Bay Model outlasted its contemporaries in active service was not only that it was indoors — the Chesapeake Bay Model was also indoors — but that “an ingenious system of 286 concrete slabs individually supported on adjustable jacks” permitted the model to be continuously reconfigured in geologic miniature to accurately represent the shifting fluid topography of the Bay area.

[The aerial image is via Google Maps; the interior shot is by flickr user chuck b.]

the mississippi basin model


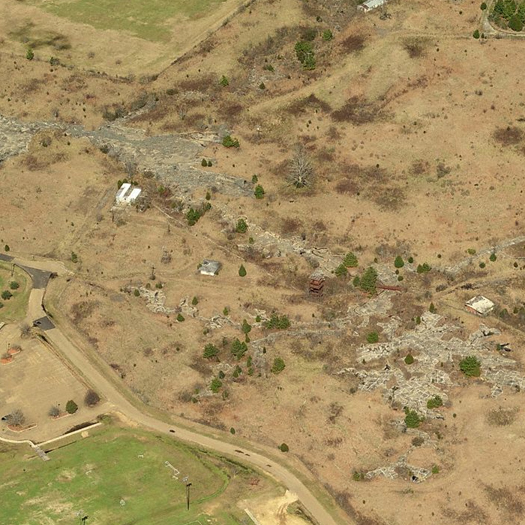
[The Mississippi River Basin Model today, via Bing Maps.]

At Places, Kristi Dykema Cheramie writes about the one of Mississippi flood control’s most fantastical landscapes, the Basin Model — “a 200-acre working hydraulic model [replicating] the Mississippi River and its major tributaries — the Tennessee, Arkansas and Missouri Rivers”, on a small tract of land just outside of Clinton, Mississippi.  Cheramie’s piece is worth reading in its entirety (her observation that the model cuts off at the Old River Control, eliminating the entire delta landscape from the modeling of the river, for instance, is extremely important, as it shows the feedback between how the river is conceived and how the river is constructed), but I’ll quote one short section, which recounts the first operational activation of the model:

“On April 1, 1952, George Stutts, a Missouri River engineer, conducted his regular field surveys of the levees in Nebraska and reported that northwest Missouri was in “no immediate danger of flooding.” [20] Only seven days later, a new survey indicated signs of imminent and severe floods. The mayors of Omaha and Council Bluffs contacted the Army Corps District Office to propose using the basin model to predict flood stages, and the model was called into active duty for the first time.

On April 18, as the Omaha World Herald rolled out the headline “Missouri River Near Crest Here; Anxious Eyes On Soggy Levees,” the basin model was halfway through 16 days of continuous 24-hour tests. Engineers issued prototype conditions to the newly installed instruments, generating simulations that forecasted likely events over the next month — crest stages, discharges, levee failure and more. As water poured through the Missouri River section of the model, the resulting data were relayed directly to aid workers in Omaha and Council Bluffs, who were able to respond with brigades of civilians and sandbags to points where levees needed to be raised only slightly; areas predicted to flood dramatically were evacuated. In total the Mississippi River Basin Model prevented an estimated $65 million in damages. [21]

With this impressive victory against the river, Reybold’s project was vindicated. The model had allowed the Mississippi River Basin to become, for the purposes of study, an object, a manageable site. Here engineers, community leaders and civilians could gather to discuss the potential ramifications of particular flood control measures and forecast likely scenarios. Each gallon of water passing through the model was the equivalent of 1.5 million gallons per minute in the real river, meaning one day could be simulated in about five minutes. This allowed for a tremendous capacity to collect data, to use the model as an active tool for communication, and to distribute information about the river as a system. With mayors from cities up and down the river gathering in the observation tower to watch the Mississippi cycle through an entire flood season, it became possible to find edges, limits and centers, to see how and where the river might strike next. The model imbued the river with a reassuring degree of certainty. Policymakers began to adjust to a new scale of thinking.”

Read the full piece at Places.

magnitude


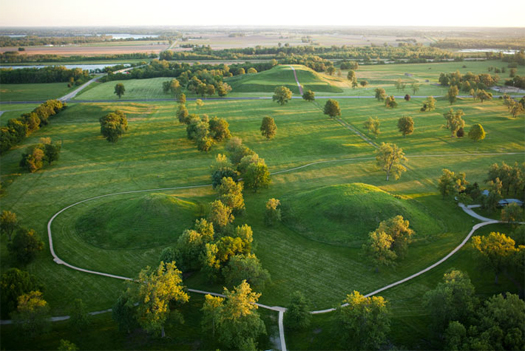
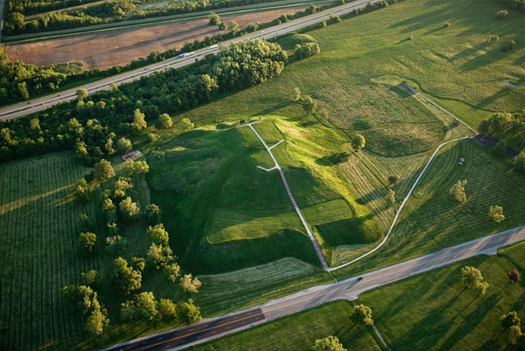
[Cahokia mounds, photographed by Ira Block for National Geographic; the mound immediately above is “Monk’s Mound”, the largest (ten stories tall) of the Cahokia mounds.]

Around a month ago, FASLANYC ran an excellent post that described the Mississippian mound culture as a potential source of inspiration for a reconsidered Louisiana delta urbanism.  In the post, FASLANYC describes the mounds themselves as a “multifunctional networked infrastructure”:

“The Mississippians were a “mound-building people”, a fragmented and fractious empire loosely associated and bound together through cultural practices, trade, and their shared environmental situation.  The capital was Cahokia — at the time the largest North American city north of Mexico — and is a prime example of this cultural practice of mound-building.  While the archeological mounds are laden with cultural significance [and this is what anthropologists tend to focus on it seems], these constructions can also be seen as a dispersed, cellular adaptation to the dynamic hydrological condition of the Mississippi Valley.

We find it interesting that even in this year’s record high flood, the indian mounds near Kincaid, Illinois stayed dry.  Trawling through the wildlife and game message boards, we came across this great thread where hunters are discussing the animals that have taken refuge on the local indian mounds, as well as the roofs of homes.  This activity is not limited just to animals.  In a 1927 issue of Science in an article titled “Indian Mounds as Flood Refuges” we read:

The thousands of terror-stricken people who have taken to Indian mounds to escape the flooding Mississippi waters are showing scientists how the Indians probably used these earthworks which they built in pre-Columbian days.

And later…

“The buildings [on top of the mounds] were probably temples, altars and the habitats of chieftains,” said [anthropologist] Dr. Kidder.  “In time of flood a mound could accommodate the entire tribe, most of the members of which probably lived in the inundated area.”

Pyramidal in structure, but with a flat top to permit erection of buildings, the mounds are about 150 feet in diameter and some fifty feet high.  They are largely confined to the flood area of the Mississippi. This practice of mound-building varied across the empire, from a few small hills near Kincaid to the imperial complex of Cahokia to the shell middens of the Louisiana Delta.  It happened at a regional landscape scale — across the entire Midwest and much of the Southeast.  And the mounds were not just burial sites, giant cosmological clocks, or the temple of the high priest; they were a multifunctional networked infrastructure — the construction of the territory as an articulated surface for resisting periodic inundation.”

1 The study of Mississippian flooding is in itself an excellent example of the differential in magnitude between American and European landscape; but expanding out from current flood conditions, we might also note that, for instance, on the USGS’s list of the world’s largest contemporary meterological floods (PDF), no European flood appears until #29 (and even then, it’s a flood in 1895 on the Danube in Romania, which is not exactly Western Europe).  By contrast, the Mississippi has a flood at #4, and the Amazon and Parana are also in the top 10 (with the 1953 Amazon flood at #1).  The floods are ranked by basin size rather than flood volume, but that only emphasizes the discrepancy in sheer size.

There are many questions that could be raised about whether the specific content of this infrastructural precedent is worth adapting, as FASLANYC suggests it could be in the specific case of New Orleans; but what I am more interested in is the general strategy of appropriating infrastructural tactics from other, earlier (and/or distant) American societies.  (Within the context of thinking about flooding, I’m interested in this because it is clear that, while America’s current riverine and littoral infrastructures do much of the work that they were intended to, they have also created unanticipated problems, face what appear to be a growing regime of unprecedented challenges, and will not last forever, particularly at today’s absymal maintenance levels.)

In particular, the practice of mound-building demonstrates very clearly the reason that infrastructurists interested in developing a specifically American infrastructural urbanism would do well to look back to the way previous American societies urbanized — it’s not just that they occupied the same ground that we do (the kind of historical precedent where a designer says “there was once a theater here, and so this restaurant will be theater-themed!”), but that there are specific tactics for responding to the unique conditions of the American landscape that are worth recalling.   Not “that’s how it was”, but “that’s how it worked”.  They dealt with the same set and magnitude of landscape processes that we do (processes which are significantly different from the Western European models we tend to rely on)1, and it seems quite possible that, in millennia of pre-colonial urbanization, American societies might have discovered a few useful tactics.

blowing the fuse


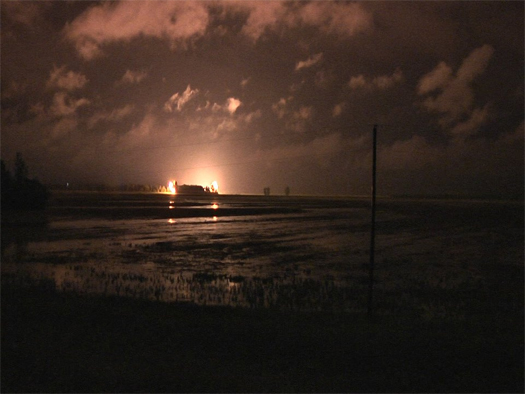
[Detonation at the Birds Point inflow crevasse, during the night of 2 May 2011.]

As sand boils appeared in Cairo, the swollen rivers continued to rise.  The city was under mandatory evacuation orders, and the flood gauge was expected to reach 63 feet — not high enough to over-top the city’s levees, but high enough to make failure quite likely.  Across the Mississippi, though, there was a release valve: the Birds Point-New Madrid floodway, an eighty-year old emergency fuse constructed, like much of the Mississippi River’s flood control infrastructures, in the wake of the 1927 floods and the hard lessons that flood taught about the futility of relying on levees alone.

Though much of the media coverage of the decision to pump blasting agents into the “horizontal polyethylene pipes” that sat within the “inflow crevasse” at Birds Point — and ignite them — focused on the attempts by the state of Missouri to halt the opening of the floodway, the lighting of this fuse is essentially automatic, triggered by long-settled legal provisions governing the Army Corps operations.  When the Cairo gauge reads 59, preparation for demolition of the levee at the inflow crevasse begins.  When it reads 60, preparations are to be completed.  When it reads 61, the Army Corps is to detonate the levee and open the floodway.  In May, despite the state of Missouri’s injunction, the levee was opened at 61.5, and the Birds Point-New Madrid floodway filled with muddy water.


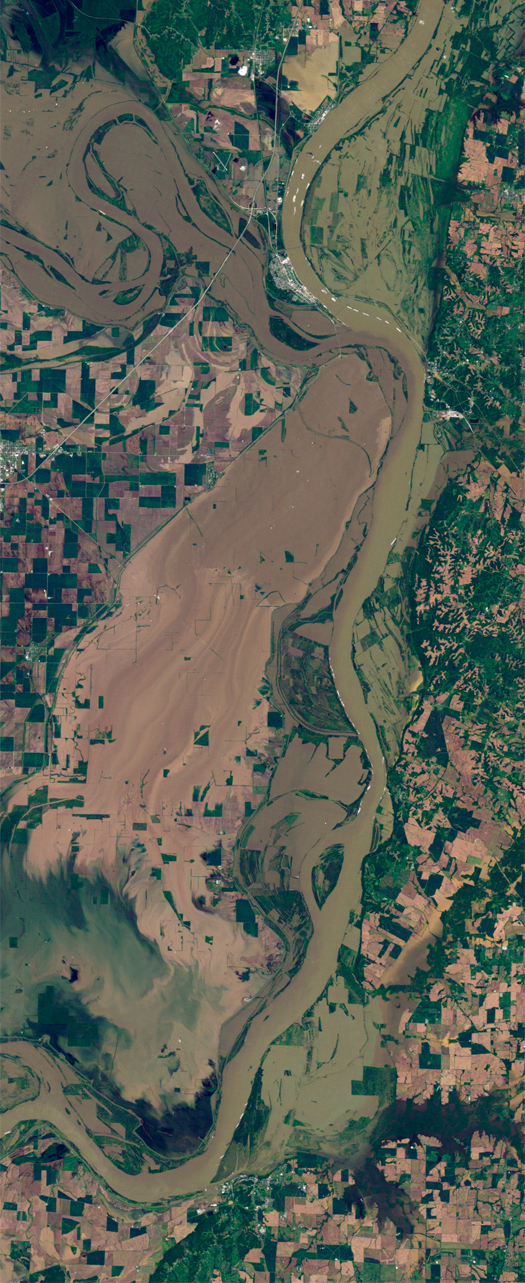
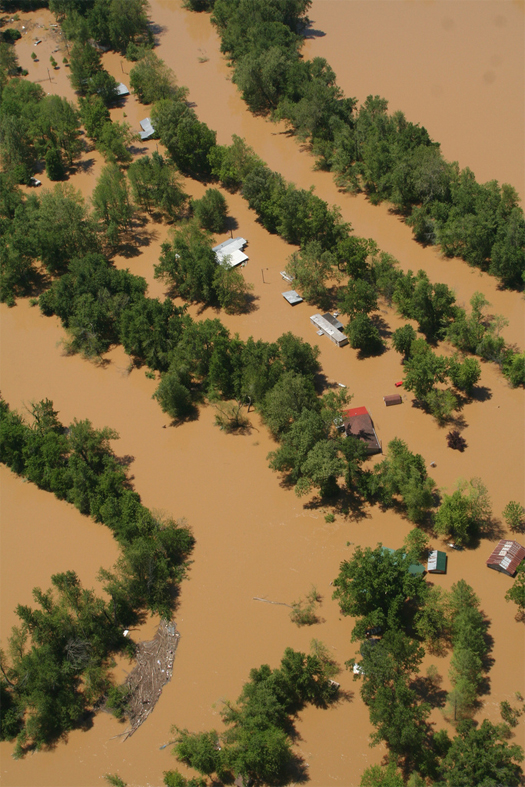
[Top, the floodway in operation, 3 May 2011, via NASA Earth Observatory; above, inundation in the floodway, via MoGov.]

The floodway operated as designed, and the levees never failed in Cairo.  (Once the floodway was opened, “water levels in the Mississippi at Cairo dropped more than 30 cm within hours.”)  This is little consolation (not none, but little), of course, to the farmers who lost fields and equipment and houses in the floodway; but the unfortunate tendency of media reporting on flooding, as Steve Gough points out, is to emphasize the narrative of disaster — the Corps blew up a levee, and farmers lost their property — at the expense of describing the structural framework (the infra-natural confluence of systems) which that narrative is embedded in.  (In this case, that framework is cobbled together from both physical and legal infrastructures — levees, blasting pipes, fuse plugs, and artificial crevasses mingling with flowage easements, the Army Corps’ binding legal framework, and an eighty-year-old emergency plan that has only been put into action twice.)  But so long as we continue to talk primarily about those micro-narratives, rather than the larger framework, we will be unable to evaluate whether the framework is actually working, and whether there are better infrastructural systems (and systems of urbanization) that could be developed.

[It’s also worth noting that this is a perfect example of why I’ve described the Mississippi River floods as infra-natural disaster, rather than merely natural disaster; nature may have provided the floodwaters, but the specific velocity and volume of floodwater was produced by the configuration of infrastructural systems, and the confluence of physical and legal infrastructures controlled where disaster appeared.]

sand boil


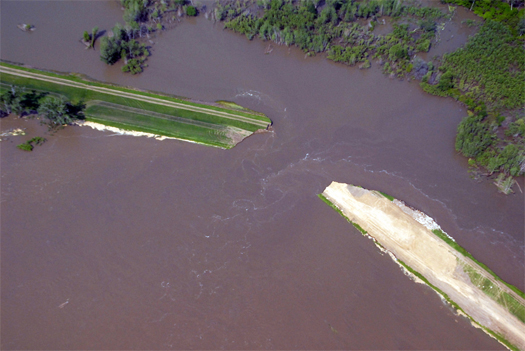
[The breach in Missouri River Levee 575, on June 14.]

The breach at Hamburg — mentioned a few posts back — began with a “sand boil”, a geotechnical phenomenon shared by earthquakes and floods, in which subterranean water pressure becomes so strong that ground water erupts, typically bubbling like a gentle geyser, and bringing soil with it.  In the case of levees, this soil is coming from inside or beneath the levee — if not contained, the sand boil essentially becomes the outlet for a concealed hydrologic pipe, conveying soil and water through the levee —  and so the sand boil represents an imminent threat to the stability of the levee.  General Derek Hill, head of Iowa Homeland Security, indicated that the sand boil at Levee 575 was around an inch in diameter.  This is an ordinary size for a sand boil.

In response, flood fighters will build rings of sand bags around the boils, in attempt to contain the boil’s water within a pool.  That pool exerts a downward force on the boil, often stabilizing the pressure on the inside and outside of the levee long enough for flood waters to recede and remove the pressure that first generated the boil.


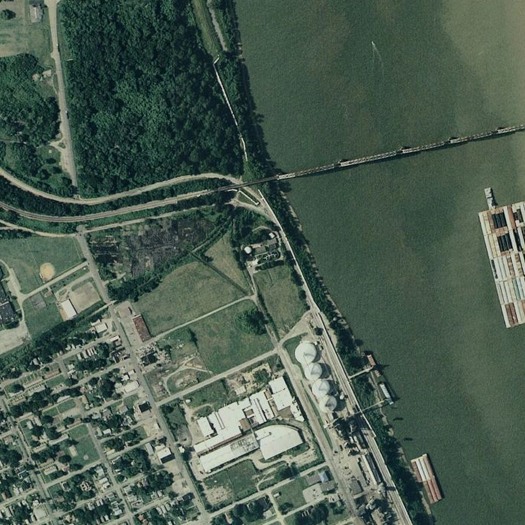
[Top: the Cairo wastewater treatment plant is at center of this image from Bing Maps; above: the sand boil at the Cairo treatment plant, via the USACE Memphis District.]

In late April, as the engorged Mississippi and Ohio Rivers swelled downstream through Illinois and Missouri, a massive sand boil appeared in Cairo, which sits at the junction of those two rivers.  This boil (above), which appeared in a field adjacent to the Ohio River (top), was, according to the Army Corps, a stunning thirty to forty feet wide — the largest sand boil ever.

patterns


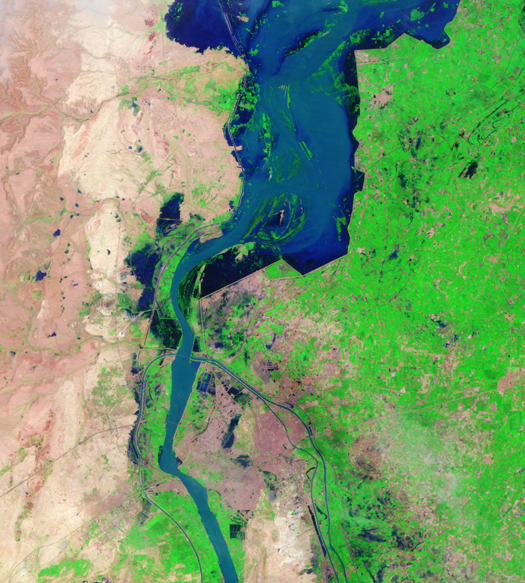
[Flooding on the Indus river around Hyderbad, Pakistan, 19 August 2010; image via NASA Earth Observatory.]

At Weather Underground, Jeff Masters reflects on the extreme weather of 2010 — which included monsoon flooding in China, the Pakistani floods (the most expensive disaster in Pakistan’s history), the Queensland flood (Australia’s most expensive natural disaster), Colombia’s record rains and flooding (also the most expensive disaster in that nation’s history), and the thousand-year flood in Nashville:

“It is difficult to say whether the weather events of a particular year are more or less extreme globally than other years, since we have no objective global index that measures extremes. However, we do for the U.S.–NOAA’s Climate Extremes Index (CEI), which looks at the percentage area of the contiguous U.S. experiencing top 10% or bottom 10% monthly maximum and minimum temperatures, monthly drought, and daily precipitation. The Climate Extremes Index rated 1998 as the most extreme year of the past century in the U.S. That year was also the warmest year since accurate records began in 1895, so it makes sense that the warmest year in Earth’s recorded history–2010–was also probably one of the most extreme for both temperature and precipitation. Hot years tend to generate more wet and dry extremes than cold years. This occurs since there is more energy available to fuel the evaporation that drives heavy rains and snows, and to make droughts hotter and drier in places where storms are avoiding. Looking back through the 1800s, which was a very cool period, I can’t find any years that had more exceptional global extremes in weather than 2010, until I reach 1816. That was the year of the devastating “Year Without a Summer”–caused by the massive climate-altering 1815 eruption of Indonesia’s Mt. Tambora, the largest volcanic eruption since at least 536 A.D. It is quite possible that 2010 was the most extreme weather year globally since 1816.

…I don’t believe that years like 2010 and 2011 will become the “new normal” in the coming decade. Many of the flood disasters in 2010 – 2011 were undoubtedly heavily influenced by the strong El Niño and La Niña events that occurred, and we’re due for a few quiet years without a strong El Niño or La Niña… But the ever-increasing amounts of heat-trapping gases humans are emitting into the air puts tremendous pressure on the climate system to shift to a new, radically different, warmer state, and the extreme weather of 2010 – 2011 suggests that the transition is already well underway. A warmer planet has more energy to power stronger storms, hotter heat waves, more intense droughts, heavier flooding rains, and record glacier melt that will drive accelerating sea level rise. I expect that by 20 – 30 years from now, extreme weather years like we witnessed in 2010 will become the new normal.”

Read the full post at the Weather Underground.

the mouse


[Just north of the Missouri River, another, smaller river has been smashing flood records, propelled by the same combination of snow pack and heavy rains.  In the oil boomtown of Minot, North Dakota, the Souris River (French for “mouse”, which has produced the local nickname “the Mouse”) has reached thirteen feet over flood stage — four feet above the previous record set in 1881 — and poured over flood defenses erected in the wake of damaging 1969 floods.  Though the floodwaters crested early on the morning of the 26th, they have been dropping slowly, putting intense pressure on emergency levees and leaving both residents and work crews with a slow, tense wait until the waters recede.

In the photo above, an Army Corps of Engineers contractor’s crane is shown lost to floodwaters during emergency levee building efforts in Minot.]

dredging fort peck


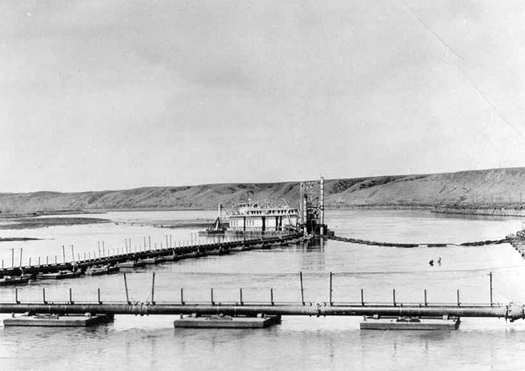
[A dredger at work in one of Fort Peck Dam’s borrow pits; photographer unknown.  (Fort Peck, you will recall, was the first of the six major dams on the Missouri to be built.)  The dredgers, pontoon boats, and booster barges used in the pumping of fill material from upstream borrow pits to the Fort Peck dam site were all built on site, resulting in the rather odd situation of shipbuilders from around the country flocking to work in landlocked Montana’s largest shipyard.]


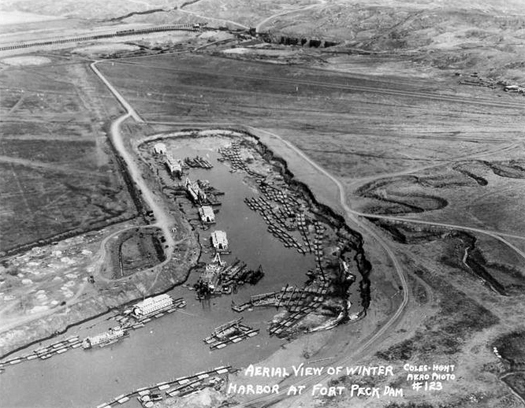
[The dredgers and other vessels all required winter refuge, as dredging and the placement of fill material halted for the season; photograph by Coles-Hight Aero Photo.]


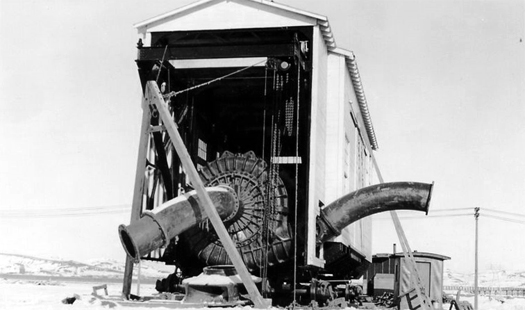
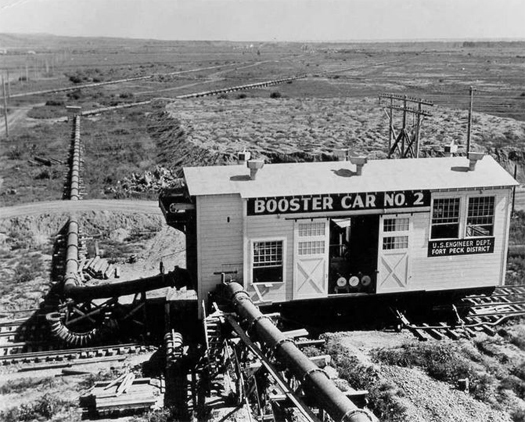
[“Boosters” (essentially, pumps) were required to keep the liquid slurry of fill material moving from dredges to the dam site; here, a “land booster” is seen under construction; photographed by Lloyd Hanson, March 1935.]


[Another land booster, here in operation, with a long length of the 28-inch diameter pipe running off towards the horizon.  The borrow pits were located upstream from the dam site, in order that the excavation would add to the future capacity of the reservoir, and had to excavate soils with specific geotechnical qualities, “mostly of sand and water, with just enough clay and silt to form an impervious core in the middle of the fill”. Photographer unknown.]


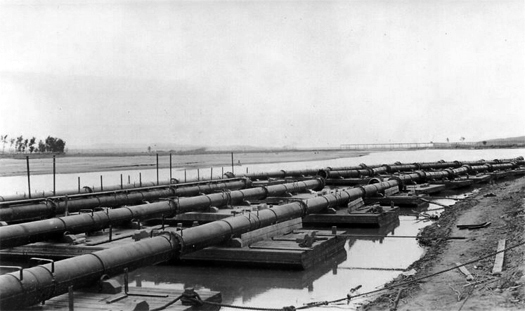
[For much of their length, the pipelines floated on pontoon barges, strings of which can be seen floating in the overwintering aerial above; photographed by Lloyd Hansen.]


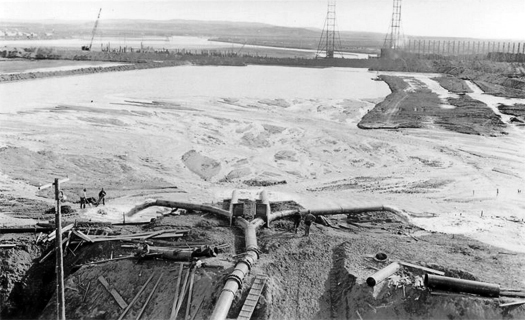
[Dredge material being spilled out at the base of the dam, photographed by Lloyd Hansen in March, 1934.  At this point, the dam was still six years (and one major accident) from completion.  The fill was dumped just inside the beginning of the slopes of the dam (marked in this aerial photograph), where is spilled into the “core pool”, a still body of water which was maintained to settle out the finest fill, which then formed the impervious core of the dam.  In the background, steel cutoff sheeting — 34 million pounds, in eventual total — was being driven into the earth, where it connected the impervious core of the dam to the shale bedrock below, creating a subterranean barrier against the movement of water beneath the earthen dam.]

[All images in this post are via fortpeckdam.com.]


ditch 6


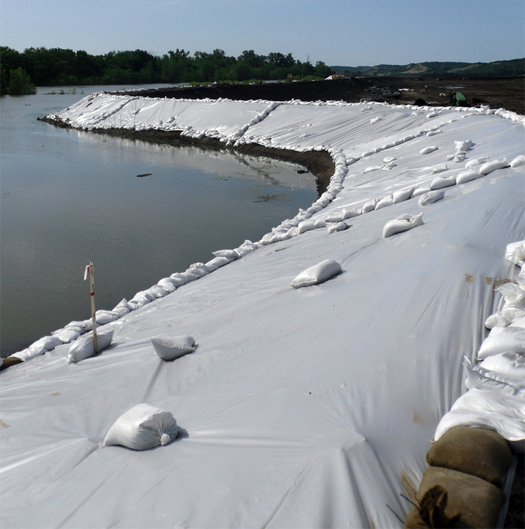
[The “Ditch 6” levee at Hamburg, Iowa; photographed by the Army Corps of Engineers on June 16.  Following the breach of levee 575 which prompted the evacuation orders for southern Hamburg, the Army Corps “immediately underwent further construction to raise the elevation of Ditch 6 levee”; the plastic sheeting protects the soft earth of the new levee from erosive wave action.]

a partial atlas of mississippi floods


[I’ll be updating this atlas as I continue to post on floods; for now, there are two categories — blue, for Missouri floods, and yellow, for historical Mississippi floods.]

six dams and six reservoirs


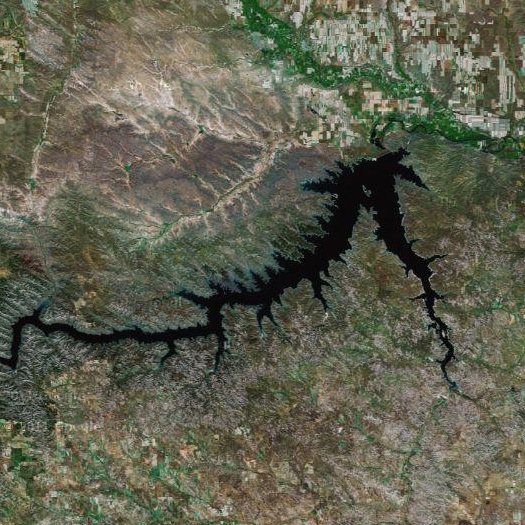
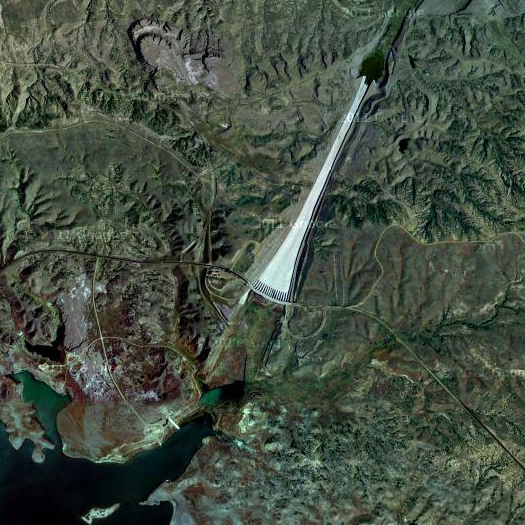
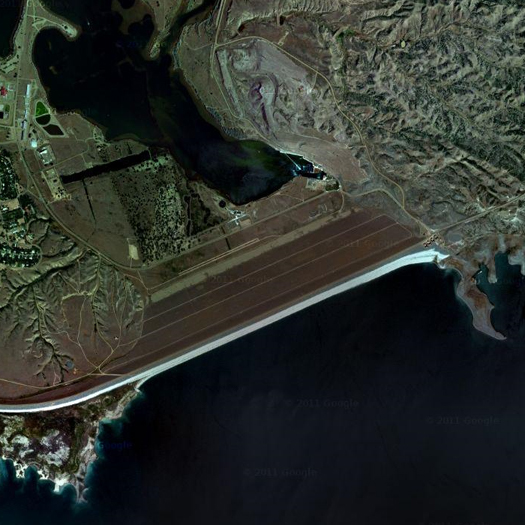
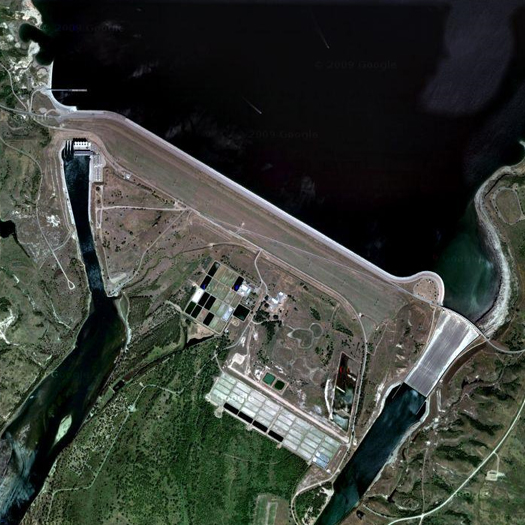
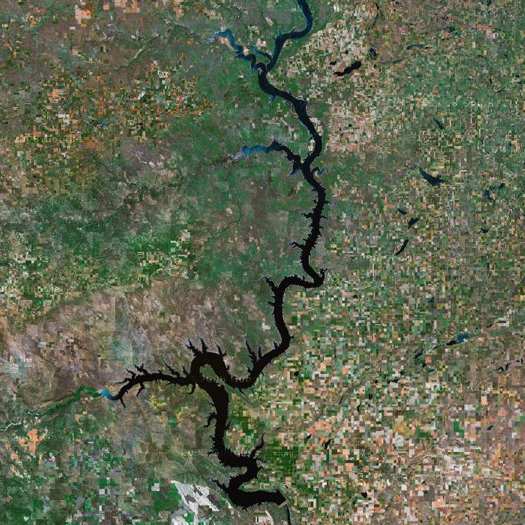
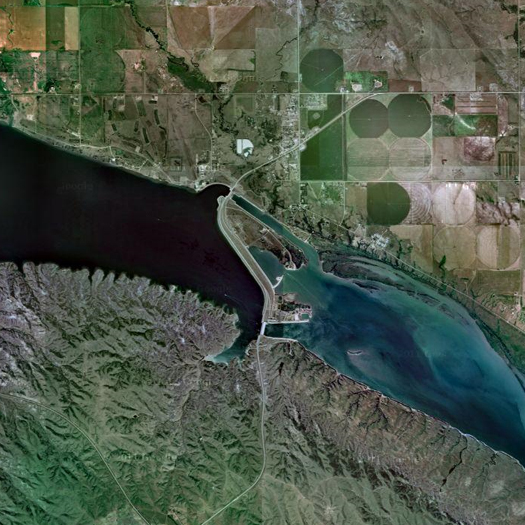
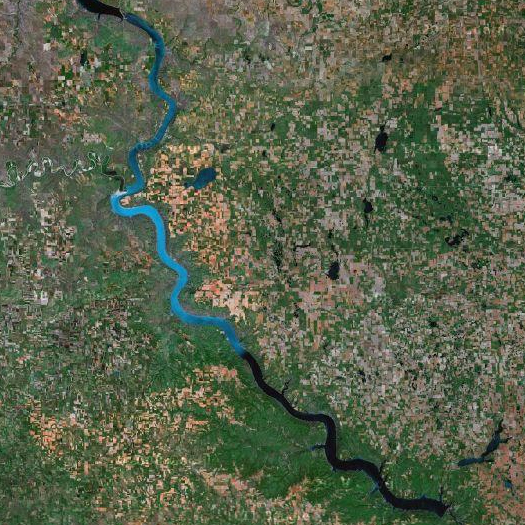
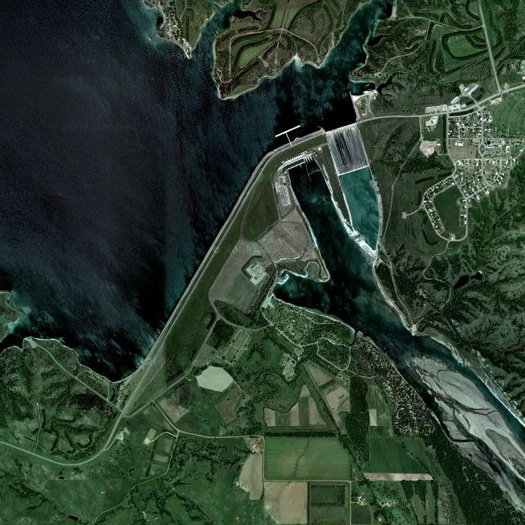
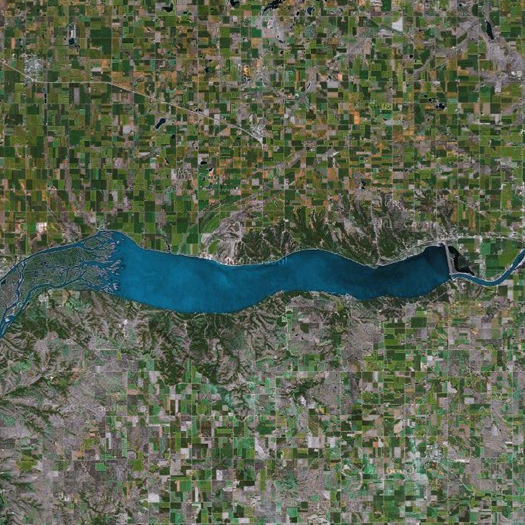
[Fort Peck Lake (top), Spillway (middle) and Dam (above), in northeast Montana; built between 1933 and 1940, Fort Peck is the world’s largest “hydraulically-filled” dam, which means that it was constructed by dredging suspended sediment from borrow pits and pumping it to discharge pipes at the dam site, where it settles onto the embankment.  (This method of construction is rarely used today, as it can be extremely unreliable; in fact, the Fort Peck Dam suffered a major failure during construction, in 1938.)  The lake the dam creates is the fifth-largest in the United States, and has a coastline longer than that of California’s Pacific coast.  Currently, the dam is releasing water at around 65,000 cubic feet per second — nearly double its previous highest release volume.]

As I mentioned back in May, massive snowpack in the Rockies is melting to produce volumes of water that will continue to push unprecedented levels of runoff through the river systems that drain the western United States throughout the summer.  Burdened by this snowmelt, the six reservoirs of the Upper Missouri — Fort Peck Lake, Lake Sakakawea, Lake Oahe, Lake Sharpe, Lake Francis Case, and Lewis and Clarke Lake — are exceptionally full, and the Army Corps of Engineers has decided it must release unprecedented volumes of water from those reservoirs for the remainder of the summer.


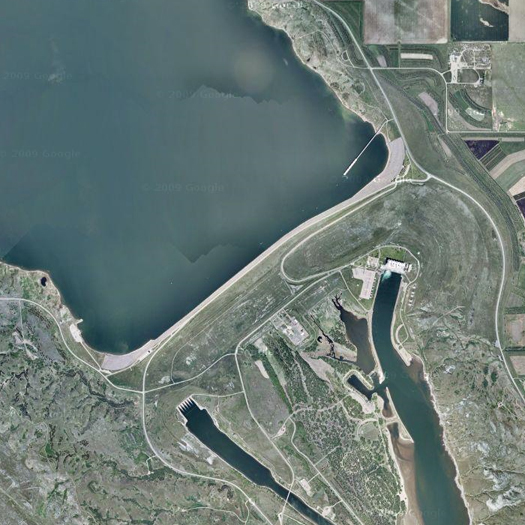
[Lake Sakakawea (top) and Garrison Dam (above), in western North Dakota.  Sakakawea is the nation’s third-largest artificial lake, while Garrison Dam is, like Fort Peck Dam, a massive earthen embankment.  In the image above, two features deserve comment: the spillway, which is on the lower-right side of the dam, and the Garrison Dam National Fish Hatchery, which supplies some 10 million fish annually, including salmon, trout, and the pallid sturgeon, to rivers and lakes in North Dakota, Wyoming, Idaho, Nevada, South Dakota, and Montana.  Being downriver from Fort Peck, Garrison Dam sees a greater volume of flow, and so is releasing around 150,000 cubic feet per second, nearly three times what Fort Peck is releasing (and, coincidentally, also nearly three times its previous record release).]

Like the Mississippi River, which it feeds into near St. Louis, the Missouri River is a complex, hybridized infra-natural system.  The riparian ecology of the Missouri’s floodplain has been almost entirely eradicated, as forest cover dropped from a high of 73% in 1826, to a mere 13% in 1972; in many places, this represents a mere single row of trees along each bank.  The historic diversity of ecosystems — “a ribbon of islands, chutes, oxbow lakes, backwaters, marshes, grasslands, and forests” —  has been replaced largely with the incredibly productive agricultural plots which appear as pixelation in the satellite images above and below.  Though the destruction of arable land by sediments deposited during and erosion caused by the great floods of 1993 and 1995 has led to a trend towards the purchase and re-naturalization of floodplain land, the general condition remains agricultural rather than riparian.  The river’s tendency to meander has been nearly eliminated, and the river has been confined “to a narrow floodplain approximately ten percent of its original width, [eliminating] side channels, quiet pools, isolated backwaters… and associated wetlands”.

The river itself has been massively altered, as well.  “Nearly one-third of the Missouri River has been impounded, another one-third channelized, and the hydrologic cycle… has been altered on the remainder”.  The river’s traditional cycle of ebb and flow — of both water volumes, which used to peak twice a year, in spring and early summer, and sediment levels (the river’s nickname was once “the Big Muddy”) have been interrupted by the presence of that impoundment and channelization.  (The river carries approximately a third to a fourth of its original sediment load.)  With erosion and deposition disrupted, the channel has degraded, as the river cannot cut side to side, and so cuts deep into its own bed; in achieving an equilibrium of flow — flattening the peaks and valleys of water flow in order to dampen flooding and combat drought — the dynamic equilibrium of sediment has been lost, and between the loss of shallow habitats (as the main channel deepens, its capacity to feed shallow bottoms around the main channel is reduced) and the alteration of hydrological conditions (temperature, seasonal flow variations, etc.), the river’s stocks of native fish have been devastated.


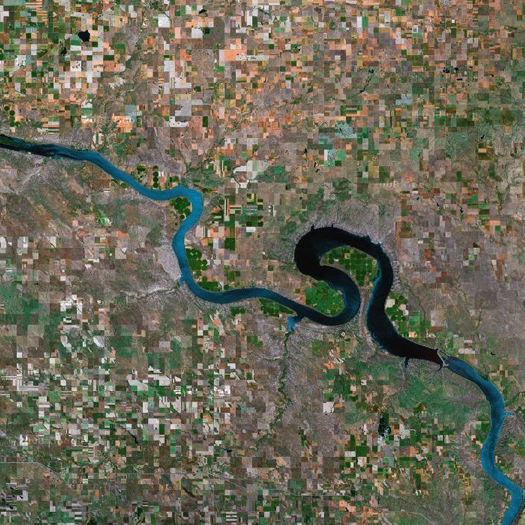
[Lake Oahe (top) and Oahe Dam (bottom).  Even as artificial lakes on the upper Missouri go, Lake Oahe is an exceptionally long and thin lake, stretching around 231 miles from just south of Bismarck, North Dakota to Pierre in central South Dakota.  Like most (all?) of the dams on the upper Missouri, Oahe Dam is pair with a major hydroelectric plant; the Oahe Plant sends power to Nebraska, Minnesota, Montana and North and South Dakota.]

Like the Misssissippi River, the infrastructural components of that system were constructed, are maintained, and are operated by the Army Corps of Engineers.  But where the Mississippi falls under the authority of the Mississippi Valley Division, the Missouri — despite the connectedness of the two rivers, which form a single continent-spanning watershed — is watched over by the Northwestern Division, whose purview stretches from the mouth of the Columbia on the Pacific, across the Rockies, and east along the Missouri.  Within the Division, two districts have specific responsibility for the Missouri: the Omaha District, which is responsible for the upper river (from Montana, including both of the Dakotas, and through Nebraska and Iowa), and the Kansas City District, which is responsible for the lower Missouri.

The six dams and reservoirs on the upper Missouri (and thus in the Omaha District) together comprise the largest system of reservoirs in the United States.  The first of these, Fort Peck Dam and Lake, was constructed by the Public Works Administration during the Great Depression. The other five — all downstream from Fort Peck — were constructed under the “Pick-Sloan plan”.  While the Army Corps began removing snags from the river in the 1820’s to improve navigability, and received funding from Congress beginning in 1881 for various projects on the Missouri, including dikes and piers to divert the river’s flow, clearing snags, and a permanent six-foot channel from Sioux City to St. Louis, it was the Pick-Sloan plan, approved in 1944, which initiated the modern era of Missouri River infrastructure.  The plan authorized over a hundred reservoirs within the Missouri basin, “but its cardinal feature was the integrated multi-purpose plan for five additional main stem dams”, “giant mounds of compacted earth [forming] a series of reservoirs with a storage capacity of more than 74 million acre-feet and a surface area of over one million acres”.

[Lake Sharpe (top) and Big Bend Dam (above); like the other four main stem dams, Big Bend is currently releasing over 150,000 cubic feet of water per second.  Big Bend was also the last of the six major dams to be completed.]

While we now know that the construction of this infra-natural system has had a host of negative consequences (specifically, the ecological and geomorphological consequences outlined above), it was proposed and built in response to very real problems, and its success in addressing those problems should not be minimized.  As World War Two raged, planners considering the future of the Missouri basin confronted multiple challenges: frequent flooding endangered lives and destroyed valuable crops; at other times, severe droughts could be just as destructive — if not more so — to agriculture, making the livelihoods of farmers in the basin precarious; and farmers were rapidly leaving farms for urban areas, a trend that was accelerated by the movement of populations in response to wartime economies.  New Deal Democrats were determined that returning soldiers not come home to depressed economies and historically-low crop prices, as they had at the end of World War One.  Flooding in 1943 emphasized the urgency of these needs, and General Lewis Pick — the Missouri River Division Engineer — and Glenn Sloan, of the Bureau of Reclamation, proposed a pair of plans which was soon combined into a single initiative that bore their names.  Construction of the main stem dams began in 1947, with Garrison Dam, and finished in 1966, with the completion of the power plant complex at Big Bend Dam.  The plan had four aims: flood control, navigation, irrigation, and hydropower; and if it was not an unqualified success (it was not), it certainly produced clear benefits in each of these areas.

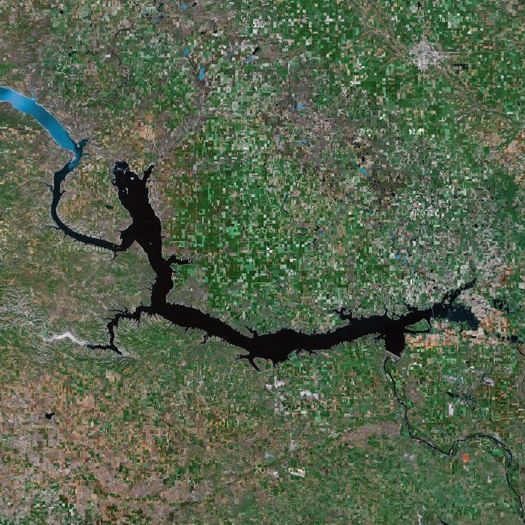
[Lake Francis Case (top) and Fort Randall Dam (above); note that Big Bend Dam is visible at the northwestern terminus of Lake Francis Case, as the lake stretches contiguously from one dam to the next.]

Today, the operations of the Army Corps of Engineers are coordinated with the Fish and Wildlife Service, as the ecosystem services provided by the river have been assigned increasing value, in a program known as the “Missouri River Recovery Program”.  The program has several major components: the creation of new shallow water habitat (the current aim is between 20 and 30 acres for every river mile by 2020); “mechanically building and maintaining” new and existing sandbars; and planting new bottomland forest, primarily cottonwoods.  The restoration sites are located between Sioux City and St. Louis, which means that these landscape operations are confined to the lower Mississippi.  The primary change on the upper Mississippi — where the dams are — has been not a constructed transformation of the riverine landscape, but, rather, an essentially operative change.  This change is the “Spring Pulse” program, in which reservoir waters are released in March and May to mimic the historic annual flows, improving both sediment transport and the quality of the river as habitat for native species.


[Lewis and Clark Lake (top) and Gavins Point Dam (above); note that something of the meandering, shallow historical character of the Missouri is visible at the western end of the lake.]

I’ve said elsewhere that I think the Army Corps is an exceptionally peculiar organization, probably the country’s most radically avant-garde landscape practice, but rarely recognized for that, as it is the scale, agency, and organizational intricacy of the Corps’ work, not its formal properties, which render it so radical.  A project like Hargreaves’ Guadeloupe River Park (rightly) receives attention for reconsidering the “paradigms of modern flood control” — but the Corps both constructed those paradigms and is currently deconstructing them, at the scale of not a single urban park, but the entire Missouri River Basin.  Who else is doing organization work on this kind of scale?  And what is the Spring Pulse, if not an infrastructural hack?

[Sources for this post include “Big Dam Era”, an Army Corps publication on the history of Missouri River infrastructures; “Sharing the Challenge”, a report by the “Interagency Floodplain Management Review Committee” recommending reactions to the Missouri and upper Mississippi floods in 1993; and materials from the Missouri River Recovery Program.  Quotes not specifically attributed to other sources are taken from these publications.  Another thing that is worth mentioning: I haven’t gone into them, but there are a host of issues related to the rights of Native populations in the basin, both historical — Native populations were displaced during the construction of the main stem dams — and contemporary, particularly concerning water rights.  Finally, all satellite imagery via Google Maps, unless otherwise noted.]


reluctant migration

In yet another great little piece at Domus, Fred Scharmen and Molly Wright Steenson look at the history and potential of the relationship between architecture and the field of interaction design, arguing that further disciplinary promiscuity would benefit both architects and interaction designers:

“Instead of bringing together users through machines, what if interaction design were reconceived to foster positive friction between different design disciplines? What would interaction design look like if it wasn’t only (or even necessarily) digital, but if it genuinely melded architecture, industrial and product design, graphic design, art, video narrative, tiny technology, large scale networks, and so on? What would debates between the disciplines be like? What might win, and more importantly, what would they unearth about interaction design in general? What other disciplines might emerge and what new visions of the world might appear? The recognition that many other fields have dealt with these issues and continue to do so, may open up a larger conversation that reveals new relationships, isomorphisms, productive frictions—even interactions.”

Read the full piece at Domus; though brief, it touches on many of mammoth‘s favorite corners of architectural academia, including the MIT Media Lab and Columbia’s Network Architecture Lab.